Exam 3: Statistical Process Control
Exam 1: Introduction to Operations and Supply Chain Management74 Questions
Exam 2: Quality Management86 Questions
Exam 3: Statistical Process Control161 Questions
Exam 4: Product Design81 Questions
Exam 5: Service Design77 Questions
Exam 6: Processes and Technology48 Questions
Exam 7: Capacity and Facilities Design90 Questions
Exam 8: Human Resources85 Questions
Exam 9: Project Management98 Questions
Exam 10: Supply Chain Management Strategy and Design73 Questions
Exam 11: Global Supply Chain Procurement and Distribution96 Questions
Exam 12: Forecasting99 Questions
Exam 13: Inventory Management25 Questions
Exam 14: Sales and Operations Planning34 Questions
Exam 15: Resource Planning86 Questions
Exam 16: Lean Systems99 Questions
Exam 17: Operational Decision-Making Tools: Decision Analysis38 Questions
Exam 18: Operational Decision-Making Tools: Acceptance Sampling28 Questions
Exam 19: Operational Decision-Making Tools: Facility Location Models23 Questions
Exam 20: Operational Decision-Making Tools: Work Measurement29 Questions
Exam 21: Operational Decison-Making Tools: Transportation and Transshipment Models102 Questions
Exam 22: Operational Decision-Making Tools: Simulation84 Questions
Exam 23: Operational Decision-Making Tools: Linear Programming92 Questions
Select questions type
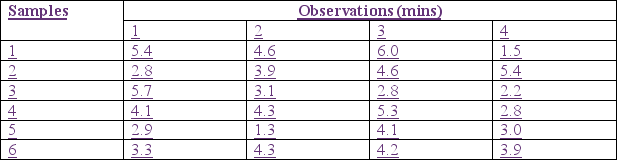
Dumplings -To-Go (DTG) provides take-out dumplings and noodle dishes to customers at its chain of drive-through restaurants. The target for a customer's waiting time is 3.0 minutes +/- 1 minute. Each month, one of the managers observes the drive-through process and collects a sample of 4 waiting times a day over a 6 day period. The data for one restaurant appears below. Calculate the process capability ratio. Is this restaurant capable of meeting DTG standards? Insert table here

(Multiple Choice)
4.7/5  (31)
(31)
Consider a production process for a 5.0 oz. energy drink. A quality engineer has taken 15 samples each containing 6 energy drinks. The sum of the ranges of the energy drinks in the 15 samples is 12.68. The sum of the average of the energy drinks in the 15 samples is 80.20. The centerline for the control chart reporting variability between the sample means is
(Multiple Choice)
4.7/5 (38)
57. If a sample of 40units of output found 500 defects, then the 3-sigma upper control limit for the chart would be 
(Multiple Choice)
4.8/5 (28)
Variable control charts are used for quantitative measures such as weight or time.
(True/False)
4.8/5 (41)
When constructing a control chart for the first time, all points should be within the control limits indicating the process is in control.
(True/False)
4.9/5 (29)
Statistical process control can prevent poor quality before it occurs if a pattern is evident in the plotted points.
(True/False)
4.8/5 (34)
All processes contain a certain amount of variation in their output.
(True/False)
4.9/5 (35)
Consider a service process such as a fast food drive through window. The target for a customer's waiting time is 3.0 minutes. A manager observes the process and randomly collects a sample of four waiting times each hour over a 12 hour period. The sum of the range for each of the 12 samples is 18.0. The UCL for the process control chart reporting variability within the samples is
(Multiple Choice)
4.9/5 (32)
The smaller the historical proportion defective reported for a process, the larger the sample size required to detect special cause (nonrandom) variation with a p-chart.
(True/False)
4.8/5 (45)
One reason some companies fail in their attempt to apply statistical process control is lack of training.
(True/False)
4.9/5 (47)
XYZ manufacturing has received an order to produce a rod 5 inches in diameter + .04 inch. In sample runs, the machine tool that will be making the rod has been able to produce rods with a mean diameter of 4.99 inches and a standard deviation of 0.011 inch. Which of the following statements is true?
a. The process is capable of meeting design spec but is off-center.
b. The process is capable of meeting design specs and is on-center.
c. The process in incapable of meeting design specs.
(Short Answer)
4.8/5 (32)
Tolerances reflect the amount of common cause variation allowed in a process.
(True/False)
4.9/5 (35)
A company manufactures a product that has a design (nominal) target width of 5 inches with tolerances of + .05 inch. The process that produces the product has a mean of 4.995 inches and a standard deviation of 0.01 inch. The process capability index for this process is
(Multiple Choice)
4.9/5 (38)
Which of the following is NOT not a primary purpose of statistical process control?
(Multiple Choice)
4.7/5 (30)
It is possible to have low variation within samples while at the same time having high variation between sample means.
(True/False)
4.9/5 (27)
Two types of variation associated with the output of a process are common (random) cause (random) and special cause (nonrandom).
(True/False)
4.9/5 (35)
58. A company randomly selects 100 light bulbs every day for 40 days from its production process. If 600 defective light bulbs are found in the sampled bulbs then the estimate for the process average percent defective would be
(Multiple Choice)
4.8/5 (31)
Dumplings -To-Go (DTG) provides take-out dumplings and noodle dishes to customers at its chain of drive-through restaurants. The target for a customer's waiting time is 3.0 minutes +/- 1 minute. Each month, one of the managers observes the drive-through process and collects a sample of 4 waiting times a day over a 6 day period. The data from one restaurant appears below. If DTG were to construct an X-bar chart from this data, the centerline would be 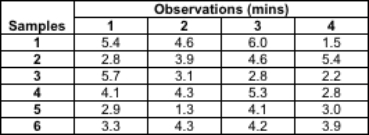
(Multiple Choice)
4.9/5 (35)
Which of the following services can be measured and monitored with control charts?
(Multiple Choice)
4.7/5 (44)
Process control is achieved by taking periodic samples from a process and plotting the sample points on a chart to determine if the process is within control limits.
(True/False)
4.9/5 (44)
Filters
- Essay(0)
- Multiple Choice(0)
- Short Answer(0)
- True False(0)
- Matching(0)