Exam 17: Time Series Forecasting and Index Numbers
Exam 1: An Introduction to Business Statistics and Analytics98 Questions
Exam 2: Descriptive Statistics and Analytics: Tabular and Graphical Methods120 Questions
Exam 3: Descriptive Statistics and Analytics: Numerical Methods145 Questions
Exam 4: Probability and Probability Models150 Questions
Exam 5: Predictive Analytics I: Trees, K-Nearest Neighbors, Naive Bayes,101 Questions
Exam 6: Discrete Random Variables150 Questions
Exam 7: Continuous Random Variables150 Questions
Exam 8: Sampling Distributions111 Questions
Exam 9: Confidence Intervals149 Questions
Exam 10: Hypothesis Testing150 Questions
Exam 11: Statistical Inferences Based on Two Samples140 Questions
Exam 12: Experimental Design and Analysis of Variance132 Questions
Exam 13: Chi-Square Tests120 Questions
Exam 14: Simple Linear Regression Analysis147 Questions
Exam 15: Multiple Regression and Model Building85 Questions
Exam 16: Predictive Analytics Ii: Logistic Regression, Discriminate Analysis,101 Questions
Exam 17: Time Series Forecasting and Index Numbers161 Questions
Exam 18: Nonparametric Methods103 Questions
Exam 19: Decision Theory90 Questions
Select questions type
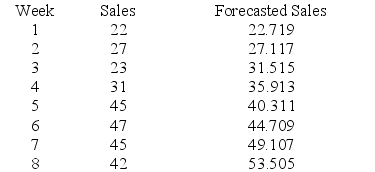
Given the following data, compute the total error (sum of the error terms).
(Short Answer)
4.9/5  (32)
(32)
Consider the following data.
 Using simple exponential smoothing with α = .2, determine the forecast error for time period 1.
(Short Answer)
4.8/5 (31)
The linear regression trend model was applied to a time series sales data set based on the last 24 months' sales. The following partial computer output was obtained.
 Write the prediction equation.
(Short Answer)
4.7/5 (32)
The ________ component of a time series reflects the long-run decline or growth in a time series.
(Multiple Choice)
4.7/5 (24)
Multiplicative decompositions assume that time series components remain essentially constant over time.
(True/False)
4.8/5 (39)
Consider the following data and calculate S2 using simple exponential smoothing
and α = .3.

(Short Answer)
4.8/5 (34)
Consider the following data.
 Calculate S5 using simple exponential smoothing if S3 = 19.064 and α = .2.
(Short Answer)
4.8/5 (27)
A sequence of values of some variable or composite of variables taken at successive, uninterrupted time periods is called a
(Multiple Choice)
4.9/5 (35)
A ________ index is a weighted aggregate price index. It is accurate in its calculation of periodic prices. However, when using this index, it is difficult to compare the prices in different time periods.
(Multiple Choice)
4.8/5 (43)
Given the following data, compute the total error (sum of the error terms).

(Short Answer)
4.9/5 (40)
Using the price of the following food items, compute the aggregate index numbers for the four types of cheese. Let 1990 be the base year for this market basket of goods.

(Short Answer)
4.7/5 (29)
A ________ index is most useful if the base quantities provide a reasonable representation of consumption patterns in succeeding time periods.
(Multiple Choice)
4.9/5 (36)
Suppose that the unadjusted seasonal factor for the month of April is 1.10. The sum of the 12 months' unadjusted seasonal factor values is 12.18. The normalized (adjusted) seasonal factor value for April
(Multiple Choice)
4.7/5 (38)
The ________ component of a time series refers to the erratic time series movements that follow no recognizable or regular pattern.
(Multiple Choice)
4.8/5 (43)
The linear regression trend model was applied to a time series of sales data based on the last 16 months of sales. The following partial computer output was obtained.
 What is the predicted value of y when t = 17?
(Short Answer)
4.8/5 (33)
Periodic patterns in time series that repeat themselves within a calendar year or less are referred to as ________.
(Multiple Choice)
4.8/5 (41)
Simple exponential smoothing is an appropriate method for prediction purposes when there is a significant trend present in a time series.
(True/False)
4.9/5 (36)
A ________ index is a weighted aggregate price index that uses the base period quantities as weights in all succeeding time periods.
(Multiple Choice)
4.7/5 (34)
Three criteria used to compare two forecasting methods are the mean absolute deviation, the mean squared deviation, and the mean absolute percentage error.
(True/False)
4.7/5 (36)
Filters
- Essay(0)
- Multiple Choice(0)
- Short Answer(0)
- True False(0)
- Matching(0)