Exam 17: Time Series Forecasting and Index Numbers
Exam 1: An Introduction to Business Statistics and Analytics98 Questions
Exam 2: Descriptive Statistics and Analytics: Tabular and Graphical Methods120 Questions
Exam 3: Descriptive Statistics and Analytics: Numerical Methods145 Questions
Exam 4: Probability and Probability Models150 Questions
Exam 5: Predictive Analytics I: Trees, K-Nearest Neighbors, Naive Bayes,101 Questions
Exam 6: Discrete Random Variables150 Questions
Exam 7: Continuous Random Variables150 Questions
Exam 8: Sampling Distributions111 Questions
Exam 9: Confidence Intervals149 Questions
Exam 10: Hypothesis Testing150 Questions
Exam 11: Statistical Inferences Based on Two Samples140 Questions
Exam 12: Experimental Design and Analysis of Variance132 Questions
Exam 13: Chi-Square Tests120 Questions
Exam 14: Simple Linear Regression Analysis147 Questions
Exam 15: Multiple Regression and Model Building85 Questions
Exam 16: Predictive Analytics Ii: Logistic Regression, Discriminate Analysis,101 Questions
Exam 17: Time Series Forecasting and Index Numbers161 Questions
Exam 18: Nonparametric Methods103 Questions
Exam 19: Decision Theory90 Questions
Select questions type
The linear regression trend model was applied to a time series sales data set based on the last 24 months' sales. The following partial computer output was obtained.
 Test the significance of the time term at α =.05. State the critical t value and make your decision using a two-sided alternative.
(Short Answer)
4.8/5  (25)
(25)
The demand for a product for the last six years has been 15, 15, 17, 18, 20, and 19. The manager wants to predict the demand for this time series using the following simple linear trend equation: trt = 12 + 2t. Use this equation to forecast the demand for this product, and then calculate the MAD.
(Multiple Choice)
4.9/5 (26)
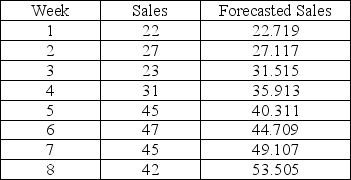
The linear trend equation for the following data is  = 1.4286 + 2.5(t) .
 Find the residual value (error) for period 7.
(Short Answer)
4.9/5 (39)
A time series decomposition method would not be used to forecast seasonal data.
(True/False)
4.9/5 (40)
Given the following data, compute the mean squared deviation (error).
(Short Answer)
4.9/5 (36)
The price and quantity of several food items are listed below for the years 1990 and 2000.
 Compute the Paasche index, using 1990 as the base year.
(Short Answer)
4.7/5 (44)
The simple moving average method is primarily useful in determining the impact of trend on a time series.
(True/False)
4.9/5 (37)
Two forecasting models were used to predict the future values of a time series. The forecasts are shown below with the actual values.
 Calculate the mean absolute deviation (MAD) for Model 2.
(Short Answer)
4.8/5 (32)
Consider the following data and calculations. Calculate the estimated value of b1 and b0, and state the linear trend regression prediction equation.

 = 28
= 28  = 140
= 140  = 80
= 80  = 1,090
  = 390
= 390
(Short Answer)
4.8/5 (33)
When there is first-order autocorrelation, the error term in period t is related to the error term in period ________.
(Multiple Choice)
4.9/5 (39)
Removing the seasonal effect by dividing the actual time series observation by the estimated seasonal factor associated with the time series observation is called deseasonalization.
(True/False)
4.9/5 (32)
Consider a time series with 15 quarterly sales observations. Using the quadratic trend model, the following partial computer output was obtained.
 Write the prediction equation.
(Short Answer)
4.8/5 (30)
Based on the following data, a forecaster used simple exponential smoothing and determined the following: S0 = 19, S1 = 18.6, S2 = 19.08, S3 = 19.064, S4 = 19.851,
and S5 = 19.481.
 Calculate the Mean Absolute Deviation (MAD).
(Short Answer)
4.8/5 (31)
Consider the quarterly production data (in thousands of units) for the XYZ manufacturing company below.
 Calculate the 4-period (quarter) centered moving average for the entire time series.
(Short Answer)
4.8/5 (38)
Two forecasting models were used to predict the future values of a time series. The forecasts are shown below with the actual values.
 Calculate the mean squared deviation (MSD) for Model 2.
(Short Answer)
4.9/5 (28)
Based on the following data, a forecaster used simple exponential smoothing and determined the following: S0 = 19, S1 = 18.6, S2 = 19.08, S3 = 19.064, S4 = 19.851,
and S5 = 19.481.
 Calculate the average forecast error.
(Short Answer)
4.9/5 (21)
When using simple exponential smoothing, the more recent the time series observation, the ________ its corresponding weight.
(Multiple Choice)
4.8/5 (25)
A simple index is computed by using the values of one time series, while a(n) ________ index is based on a "market basket" consisting of more than one time series.
(Multiple Choice)
4.8/5 (32)
Consider the quarterly production data (in thousands of units) for the XYZ manufacturing company below. The normalized (adjusted) seasonal factors are winter = .9982, spring = .9263, summer = 1.139, and fall = .9365.
 Based on the following deseasonalized observations (dt), a trend line was estimated. The linear regression trend equation is trt = 10.1 + 1.91(t). Based on this trend equation, the following trend values are calculated for each period in the time series.
Year
1998
Based on the following deseasonalized observations (dt), a trend line was estimated. The linear regression trend equation is trt = 10.1 + 1.91(t). Based on this trend equation, the following trend values are calculated for each period in the time series.
Year
1998
 Year
1999
Year
1999
 Year
2000
Year
2000
 Isolate the cyclical and irregular components by calculating the estimate of CLt × IRt for the first four quarters in the time series.
(Short Answer)
4.9/5 (42)
Filters
- Essay(0)
- Multiple Choice(0)
- Short Answer(0)
- True False(0)
- Matching(0)