Exam 17: Multiple Regression
Exam 1: What Is Statistics43 Questions
Exam 2: Graphical Descriptive Techniques I93 Questions
Exam 3: Graphical Descriptive Techniques II183 Questions
Exam 4: Numerical Descriptive Techniques274 Questions
Exam 5: Data Collection and Sampling82 Questions
Exam 6: Probability234 Questions
Exam 7: Random Variables and Discrete Probability Distributions274 Questions
Exam 8: Continuous Probability Distributions215 Questions
Exam 9: Sampling Distributions153 Questions
Exam 10: Introduction to Estimation152 Questions
Exam 11: Introduction to Hypothesis Testing182 Questions
Exam 12: Inference About a Population147 Questions
Exam 13: Inference About Comparing Two Populations170 Questions
Exam 14: Analysis of Variance153 Questions
Exam 15: Chi-Squared Tests175 Questions
Exam 16: Simple Linear Regression and Correlation298 Questions
Exam 17: Multiple Regression157 Questions
Select questions type
A multiple regression model has the form 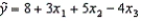 .As x3 increases by one unit, with x1 and x2 held constant, the y on average is expected to:
(Multiple Choice)
4.8/5  (35)
(35)
There are several clues to the presence of multicollinearity.One clue is when an independent variable is added or deleted, the regression coefficients for the other variables ____________________.
(Short Answer)
5.0/5 (37)
In a multiple regression analysis, if the model provides a poor fit, this indicates that:
(Multiple Choice)
4.9/5 (33)
There are several clues to the presence of multicollinearity.One clue is when a regression coefficient exhibits the wrong ____________________.
(Short Answer)
4.8/5 (36)
Real Estate Builder
A real estate builder wishes to determine how house size is influenced by family income, family size, and education of the head of household.House size is measured in hundreds of square feet, income is measured in thousands of dollars, and education is measured in years.A partial computer output is shown below.
SUMMARY OUTPUT
 ANOVA
ANOVA

 -{Real Estate Builder Narrative} Suppose the builder wants to test whether the coefficient on income is significantly different from 0.What is the value of the relevant t-statistic?
(Short Answer)
4.9/5 (36)
Life Expectancy
An actuary wanted to develop a model to predict how long individuals will live.After consulting a number of physicians, she collected the age at death (y), the average number of hours of exercise per week (x1), the cholesterol level (x2), and the number of points that the individual's blood pressure exceeded the recommended value (x3).A random sample of 40 individuals was selected.The computer output of the multiple regression model is shown below.
THE REGRESSION EQUATION IS
y = 55.8 + 1.79x1 - 0.021x2 -0.061x3

 ANALYSIS OF VARIANCE
 -{Life Expectancy Narrative} Interpret the coefficient b1.
(Essay)
4.9/5 (38)
For the following multiple regression model: 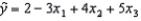 , a unit increase in x1, holding x2 and x3 constant, results in:
(Multiple Choice)
4.9/5 (30)
A high value of the coefficient of determination significantly above 0 in multiple regression, accompanied by insignificant t-statistics on all parameter estimates, very often indicates a high correlation between independent variables in the model.
(True/False)
4.8/5 (34)
A multiple regression model has the form  .The coefficient b1 is interpreted as the change in the average value of y per unit change in ________ holding ________ constant.
(Short Answer)
4.8/5 (36)
In a multiple regression analysis involving 4 independent variables and 30 data points, the number of degrees of freedom associated with the sum of squares for error, SSE, is 25.
(True/False)
4.7/5 (33)
In order to test the significance of a multiple regression model involving 4 independent variables and 25 observations, the numerator and denominator degrees of freedom for the critical value of F are 3 and 21, respectively.
(True/False)
4.7/5 (35)
A practical way to identify multicollinearity is through the examination of a correlation ____________________ that shows the correlations of each variable with each of the other variables.
(Short Answer)
4.8/5 (37)
A multiple regression model involves 5 independent variables and a sample of 10 data points.If we want to test the validity of the model at the 5% significance level, the critical value is:
(Multiple Choice)
4.9/5 (29)
When an additional explanatory variable is introduced into a multiple regression model, the coefficient of determination will never decrease.
(True/False)
4.8/5 (33)
Real Estate Builder
A real estate builder wishes to determine how house size is influenced by family income, family size, and education of the head of household.House size is measured in hundreds of square feet, income is measured in thousands of dollars, and education is measured in years.A partial computer output is shown below.
SUMMARY OUTPUT
ANOVA
-{Real Estate Builder Narrative} When the builder used a simple linear regression model with house size as the dependent variable and education as the independent variable, he obtained an R-square value of 23.0%.What additional percentage of the total variation in house size has been explained by including family size and income in the multiple regression?
(Essay)
4.8/5 (36)
For a multiple regression model, the following statistics are given: Total variation in y = 500, SSE = 80, and n = 25.Then, the coefficient of determination is:
(Multiple Choice)
4.9/5 (35)
The total variation in y is equal to SSR + ____________________.
(Short Answer)
4.8/5 (38)
To use the Durbin-Watson test to test for negative first-order autocorrelation, the null hypothesis will be H0: ____________________ (there is/there is no) first-order autocorrelation.
(Short Answer)
4.9/5 (32)
In a multiple regression model, the value of the coefficient of determination has to fall between
(Multiple Choice)
4.8/5 (41)
The validity of a multiple regression model is tested using a(n) _________ test.
(Short Answer)
4.8/5 (35)
Filters
- Essay(0)
- Multiple Choice(0)
- Short Answer(0)
- True False(0)
- Matching(0)