Exam 17: Multiple Regression
Exam 1: What Is Statistics43 Questions
Exam 2: Graphical Descriptive Techniques I93 Questions
Exam 3: Graphical Descriptive Techniques II183 Questions
Exam 4: Numerical Descriptive Techniques274 Questions
Exam 5: Data Collection and Sampling82 Questions
Exam 6: Probability234 Questions
Exam 7: Random Variables and Discrete Probability Distributions274 Questions
Exam 8: Continuous Probability Distributions215 Questions
Exam 9: Sampling Distributions153 Questions
Exam 10: Introduction to Estimation152 Questions
Exam 11: Introduction to Hypothesis Testing182 Questions
Exam 12: Inference About a Population147 Questions
Exam 13: Inference About Comparing Two Populations170 Questions
Exam 14: Analysis of Variance153 Questions
Exam 15: Chi-Squared Tests175 Questions
Exam 16: Simple Linear Regression and Correlation298 Questions
Exam 17: Multiple Regression157 Questions
Select questions type
In regression analysis, the total variation in the dependent variable y, measured by  , can be decomposed into two parts: the explained variation, measured by SSR, and the unexplained variation, measured by SSE.
(True/False)
4.8/5  (29)
(29)
Real Estate Builder
A real estate builder wishes to determine how house size is influenced by family income, family size, and education of the head of household.House size is measured in hundreds of square feet, income is measured in thousands of dollars, and education is measured in years.A partial computer output is shown below.
SUMMARY OUTPUT
 ANOVA
ANOVA

 -{Real Estate Builder Narrative} Which of the following values for the level of significance is the smallest for which at least two explanatory variables are significant individually: = .01, .05, .10, and .15?
(Short Answer)
4.9/5 (34)
In order to test the validity of a multiple regression model involving 5 independent variables and 30 observations, the numerator and denominator degrees of freedom for the critical value of F are, respectively,
(Multiple Choice)
4.9/5 (31)
In multiple regression analysis, when the response surface (the graphical depiction of the regression equation) hits every single point, the sum of squares for error SSE = 0, the standard error of estimate s = 0, and the coefficient of determination R2 = 1.
(True/False)
4.9/5 (45)
Real Estate Builder
A real estate builder wishes to determine how house size is influenced by family income, family size, and education of the head of household.House size is measured in hundreds of square feet, income is measured in thousands of dollars, and education is measured in years.A partial computer output is shown below.
SUMMARY OUTPUT
ANOVA
-{Real Estate Builder Narrative} What are the numerator and denominator degrees of freedom for the F-statistic?
(Essay)
4.9/5 (37)
Multicollinearity is present when there is a high degree of correlation between the dependent variable and any of the independent variables.
(True/False)
4.8/5 (32)
Some of the requirements for the error variable in a multiple regression model are that the probability distribution is ____________________ with a mean of ____________________.
(Short Answer)
4.7/5 (32)
Test the hypotheses H0: no first-order autocorrelation vs.H1: first-order autocorrelation, given that: Durbin-Watson Statistic d = 1.89, n = 28, k = 3, and = 0.01.
(Essay)
4.9/5 (37)
Life Expectancy
An actuary wanted to develop a model to predict how long individuals will live.After consulting a number of physicians, she collected the age at death (y), the average number of hours of exercise per week (x1), the cholesterol level (x2), and the number of points that the individual's blood pressure exceeded the recommended value (x3).A random sample of 40 individuals was selected.The computer output of the multiple regression model is shown below.
THE REGRESSION EQUATION IS
y = 55.8 + 1.79x1 - 0.021x2 -0.061x3

 ANALYSIS OF VARIANCE
 -{Life Expectancy Narrative} Is there enough evidence at the 5% significance level to infer that the model is useful in predicting length of life?
(Essay)
4.8/5 (37)
The adjusted coefficient of determination is adjusted for the:
(Multiple Choice)
4.9/5 (34)
A small value of F indicates that most of the variation in y is explained by the regression equation and that the model is useful.
(True/False)
4.9/5 (28)
In reference to the equation 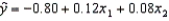 , the value -0.80 is the y-intercept.
(True/False)
4.8/5 (30)
The computer output for the multiple regression model  is shown below.However, because of a printer malfunction some of the results are not shown.These are indicated by the boldface letters a to i.Fill in the missing results (up to three decimal places).

 ANALYSIS OF VARIANCE

(Essay)
4.9/5 (31)
The range of the values of the Durbin-Watson statistic d is ____________________.
(Short Answer)
4.8/5 (26)
Large values of the Durbin-Watson statistic d (d > 2) indicate a positive first-order autocorrelation.
(True/False)
4.8/5 (27)
Life Expectancy
An actuary wanted to develop a model to predict how long individuals will live.After consulting a number of physicians, she collected the age at death (y), the average number of hours of exercise per week (x1), the cholesterol level (x2), and the number of points that the individual's blood pressure exceeded the recommended value (x3).A random sample of 40 individuals was selected.The computer output of the multiple regression model is shown below.
THE REGRESSION EQUATION IS
y = 55.8 + 1.79x1 - 0.021x2 -0.061x3
ANALYSIS OF VARIANCE
-{Life Expectancy Narrative} What is the adjusted coefficient of determination in this situation? What does this statistic tell you?
(Essay)
4.9/5 (42)
In multiple regression analysis, the adjusted coefficient of determination is adjusted for the number of independent variables and the sample size.
(True/False)
4.8/5 (34)
Filters
- Essay(0)
- Multiple Choice(0)
- Short Answer(0)
- True False(0)
- Matching(0)