Exam 13: Simple Linear Regression and Correlation: Inferential Methods
Exam 1: The Role of Statistics and the Data Analysis Process17 Questions
Exam 2: Collecting Data Sensibly39 Questions
Exam 3: Graphical Methods for Describing Data25 Questions
Exam 4: Numerical Methods for Describing Data26 Questions
Exam 5: Summarizing Bivariate Data37 Questions
Exam 6: Probability34 Questions
Exam 7: Random Variables and Probability Distributions45 Questions
Exam 8: Sampling Variability and Sampling Distributions27 Questions
Exam 9: Estimation Using a Single Sample46 Questions
Exam 10: Hypothesis Testing Using a Single Sample37 Questions
Exam 11: Comparing Two Populations or Treatments42 Questions
Exam 12: The Analysis of Categorical Data and Goodness-Of-Fit Tests21 Questions
Exam 13: Simple Linear Regression and Correlation: Inferential Methods56 Questions
Exam 14: Multiple Regression Analysis38 Questions
Exam 15: Analysis of Variance40 Questions
Exam 16: Nonparametric Distribution-Free Statistical Methods15 Questions
Select questions type
The estimated standard deviation, se, has n − 1 degrees freedom.
(True/False)
4.8/5  (35)
(35)
When the four basic assumptions for a simple linear regression model are satisfied,
a) What is μb equal to?
b) What is σb equal to? c) What is the shape of the sampling distribution of b?
d) What is the probability distribution of the standardized variable,  ?
?
(Essay)
4.9/5 (33)
The scatter plot and residual plot shown below is from a regression analysis of Prehistoric Native American projectile points. The widths of the projectiles were regressed on the length of the projectile points. 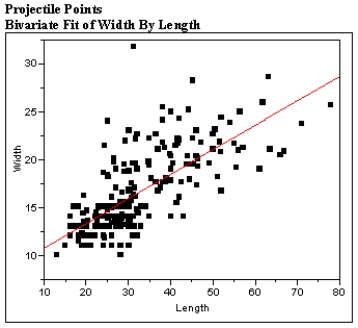
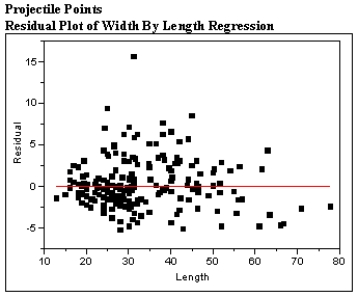 Using these plots categorize each of the Basic Assumptions of the simple linear regression model as one of the following:
a) Not checkable
b) Checked and met
c) Checked and not met
For all assumptions checked, explain what aspect of the graphs led you to your conclusion that the assumption was met or not met.
Using these plots categorize each of the Basic Assumptions of the simple linear regression model as one of the following:
a) Not checkable
b) Checked and met
c) Checked and not met
For all assumptions checked, explain what aspect of the graphs led you to your conclusion that the assumption was met or not met.
(Essay)
4.9/5 (40)
In the simple linear regression model, the point estimate and the point prediction are identical for a particular value of x.
(True/False)
4.8/5 (40)
The estimated mean value of y is a + bx* when x has the value x*.
(True/False)
4.9/5 (43)
The computer output given below shows a regression of Science Knowledge vs. Reading Comprehension scores for a random sample of sophomores. 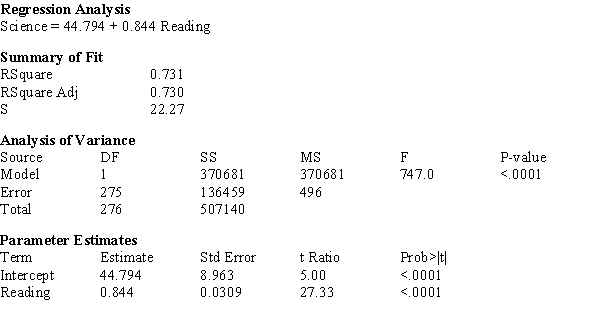
a) What is the estimated regression line?
b) What is the calculated value of sb?
c) What is the calculated value of se?
d) What is the calculated value of the t-ratio for the Model Utility Test?
e) Construct a 95% confidence interval for β.
a) What is the estimated regression line?
b) What is the calculated value of sb?
c) What is the calculated value of se?
d) What is the calculated value of the t-ratio for the Model Utility Test?
e) Construct a 95% confidence interval for β.
(Essay)
4.9/5 (36)
The general form of additive probabilistic model is y = deterministic function + random deviation.
(True/False)
4.9/5 (40)
A random sample of steelhead trout was selected; the length of the trout in inches and the weight of the trout in pounds were measured. Fitting the simple linear regression model gave the estimated regression equation 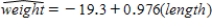 .
a) How would you interpret b = 0.976?
b) Substituting x = 30 gives
.
a) How would you interpret b = 0.976?
b) Substituting x = 30 gives  = 9.98. Give two different interpretations of this number.
c) What happens if you predict the weight of an 18-inch trout? In a few sentences, explain why do you think this has occurred.
d) The value of r2 is not presented here, but explain how you would interpret r2 in the context of this problem.
= 9.98. Give two different interpretations of this number.
c) What happens if you predict the weight of an 18-inch trout? In a few sentences, explain why do you think this has occurred.
d) The value of r2 is not presented here, but explain how you would interpret r2 in the context of this problem.
(Essay)
4.8/5 (38)
In the simple linear regression, the standard deviation of y is the same as the standard deviation of the random deviation e.
(True/False)
4.9/5 (26)
In the simple linear regression model, α and β are fixed numbers that are usually unknown.
(True/False)
5.0/5 (38)
There is more uncertainty in predicting a single value of y than with estimating a mean value of α + βx*.
(True/False)
4.8/5 (35)
In a study of the bidding behavior when antique grandfather clocks are sold at auction, investigators analyzed the selling price (y) vs. the number of bidders at the auction of the grandfather clock (x). Summary quantities from this analysis yield: n = 32  Sxx = 249.97
 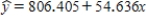 se = 367.197
a) Calculate the estimated standard deviation of a + bx* for x* = 10.
b) For what value x* is the estimated standard deviation of a + bx* smallest, and why?
se = 367.197
a) Calculate the estimated standard deviation of a + bx* for x* = 10.
b) For what value x* is the estimated standard deviation of a + bx* smallest, and why?
(Essay)
4.8/5 (32)
The computer output given below shows a regression of Social Studies Concepts vs. Reading Comprehension scores for a random sample of sophomores. Regression Analysis Social Studies = 76.56 + 0.731Reading 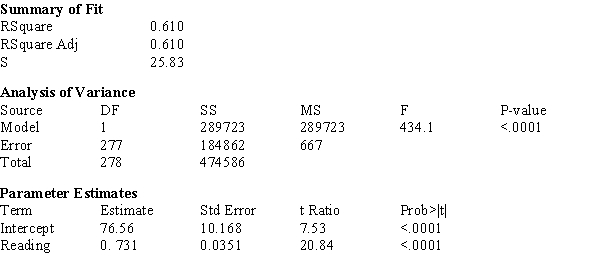
a) What is the estimated regression line?
b) What is the calculated value of sb?
c) What is the calculated value of se?
d) What is the calculated value of the t-ratio for the Model Utility Test?
e) Construct a 95% confidence interval for β.
a) What is the estimated regression line?
b) What is the calculated value of sb?
c) What is the calculated value of se?
d) What is the calculated value of the t-ratio for the Model Utility Test?
e) Construct a 95% confidence interval for β.
(Essay)
4.8/5 (27)
In a random sample of large cities around the world, the ozone level (in parts per million) and the population (in millions) were measured. Fitting the simple linear regression model gave the estimated regression equation  .
a) How would you interpret b = 16.6?
b) Substituting x = 3 gives
.
a) How would you interpret b = 16.6?
b) Substituting x = 3 gives  = 58.69. Give two different interpretations of this number.
c) Do you think this equation should be used for predicting ozone in small towns in Iowa? Explain your response in a few sentences.
d) The value of r2 is not presented here, but explain how you would interpret r2 in the context of this problem.
= 58.69. Give two different interpretations of this number.
c) Do you think this equation should be used for predicting ozone in small towns in Iowa? Explain your response in a few sentences.
d) The value of r2 is not presented here, but explain how you would interpret r2 in the context of this problem.
(Essay)
5.0/5 (32)
A study investigating the relationship between the major league batting average of non-pitching rookies (y) and their career minor league batting average (x) yields the following data: 
a) Write the estimated regression line below.
b) On the graph below, sketch the sample regression line using the information above. Be sure to label and scale your axes correctly.
a) Write the estimated regression line below.
b) On the graph below, sketch the sample regression line using the information above. Be sure to label and scale your axes correctly.  c) What is your estimate of the average change in major-league batting average associated with an increase of 0.050 in the career minor-league batting average?
d) What major-league batting average would you predict for a randomly selected individual with a career minor-league batting average of 0.300?
e) The value of se is 0.015. Interpret se in the context of this problem.
c) What is your estimate of the average change in major-league batting average associated with an increase of 0.050 in the career minor-league batting average?
d) What major-league batting average would you predict for a randomly selected individual with a career minor-league batting average of 0.300?
e) The value of se is 0.015. Interpret se in the context of this problem.
(Essay)
4.8/5 (29)
In the simple linear regression mode, σe depends on the value of x.
(True/False)
4.8/5 (40)
The manufacturer of packaging materials examines the relationship between x = strength of the fiber and y = temperature during the production process. The obtained data are given in the table. 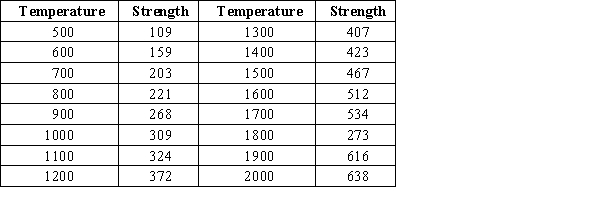 The accompanying fitted line plot is from Minitab.
 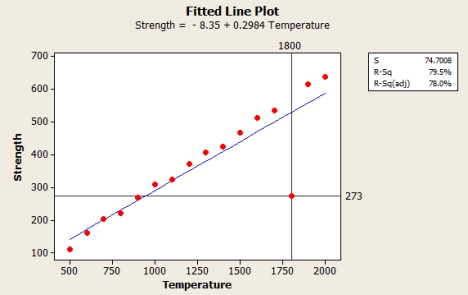 If the selected outlier (1800, 273) is deleted from the data set, how would it affect the R-squared value?
(Multiple Choice)
4.9/5 (36)
The estimated standard deviation, se, is roughly the magnitude of a typical deviation from the least squares regression line.
(True/False)
4.8/5 (38)
In a study of the bidding behavior when antique grandfather clocks are sold at auction, investigators analyzed the selling price (y) vs. the number of bidders at the auction of the grandfather clock (x). Summary quantities from this analysis yield: n = 32  Sxx = 249.97
  se = 367.197
a) Obtain a 95% confidence interval for α + β(10), the true mean selling price when the number of bidders is 10.
b) Obtain a 95% prediction interval for the price of a single grandfather clock when the number of bidders is 10.
se = 367.197
a) Obtain a 95% confidence interval for α + β(10), the true mean selling price when the number of bidders is 10.
b) Obtain a 95% prediction interval for the price of a single grandfather clock when the number of bidders is 10.
(Essay)
4.8/5 (33)
The computer output given below shows a regression of Wing Length (mm) vs. Body Mass (g) for sphinx moths. 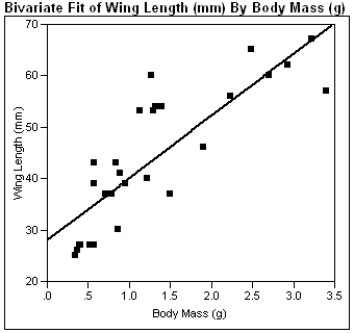
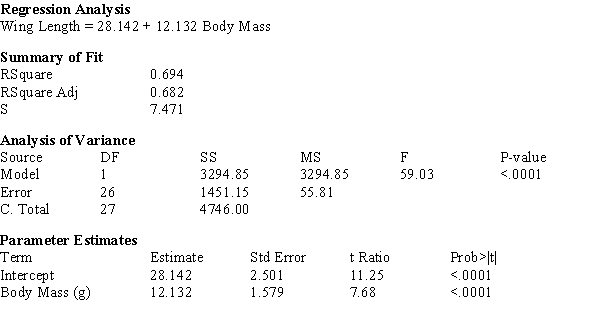
a) What is the estimated regression line?
b) What is the calculated value of sb?
c) What is the calculated value of se?
d) In a few sentences, interpret se in the context of this problem.
e) Using the computer output above, perform the Model Utility Test at the .05 level of significance.
f) Construct a 95% confidence interval for β.
(Essay)
4.9/5 (28)
Filters
- Essay(0)
- Multiple Choice(0)
- Short Answer(0)
- True False(0)
- Matching(0)