Exam 6: Random Variables and Probability Distributions
Exam 1: Collecting Data in Reasonable Ways56 Questions
Exam 2: Graphical Methods for Describing Data Distributions62 Questions
Exam 3: Numerical Methods for Describing Data Distributions37 Questions
Exam 4: Describing Bivariate Numerical Data70 Questions
Exam 5: Probability55 Questions
Exam 6: Random Variables and Probability Distributions72 Questions
Exam 7: An Overview of Statistical Inference - Learning From Data19 Questions
Exam 8: Sampling Variability and Sampling Distributions35 Questions
Exam 9: Estimating a Population Proportion36 Questions
Exam 10: Asking and Answering Questions About a Population Proportion31 Questions
Exam 11: Asking and Answering Questions About the Difference Between Two Proportions42 Questions
Exam 12: Asking and Answering Questions About a Population Mean51 Questions
Exam 13: Asking and Answering Questions About the Difference Between Two Means46 Questions
Exam 14: Learning From Categorical Data36 Questions
Exam 15: Understanding Relationships - Numerical Data Part 243 Questions
Exam 16: Asking and Answering Questions About More Than Two Means25 Questions
Select questions type
In a certain very large city, the Department of Transportation (D.O.T.) has organized a complex system of bus transportation. In an advertising campaign, citizens are encouraged to use the new "GO-D.O.T!" system and head for the nearest bus stop to be transported to and from the central city. Suppose that at one of the bus stops the amount of time (in minutes) that a commuter must wait for a bus is a uniformly distributed random variable, T. The values of T run from 0 minutes to 30 minutes.
a)Sketch the probability distribution of T.
b)What is the probability that a random commuter will spend more than 12 minutes waiting for GO-D.O.T?
(Essay)
5.0/5  (43)
(43)
Suppose that the maximum daily temperature in Hacienda Heights, CA, for the month of December has a mean of 17°Celsius with a standard deviation of 3°Celsius. Let F be the random variable maximum daily temperature in degrees Fahrenheit. (Degrees  .)a)What is the mean of F?
b)What is the standard deviation of F?
.)a)What is the mean of F?
b)What is the standard deviation of F?
(Essay)
4.9/5 (42)
During World War II The German forces launched "flying-bombs" (missiles) against London. In a study of the effectiveness of these flying-bombs, a researcher divided the south of London into 575 squares of area equal to 0.25 square km and counted the number of these squares that had sustained exactly k hits. The data for 0 - 4 hits in an area is given in the table below. 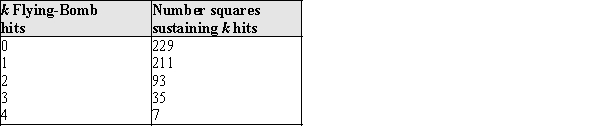 Let the random variable x = number of flying-bombs hitting in a randomly selected square in south London.
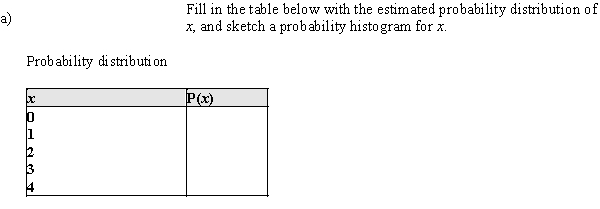
Probability histogram
Probability histogram 
b)Using your estimated probabilities in part (a), estimate the following:
i)P(x = 1), the probability that 1 flying bomb hit in a randomly selected square.
ii)P(x < 3), the probability that fewer than 3 flying bombs hit.
iii)P(x ≥ 3), the probability that at least 3 flying bombs hit.
b)Using your estimated probabilities in part (a), estimate the following:
i)P(x = 1), the probability that 1 flying bomb hit in a randomly selected square.
ii)P(x < 3), the probability that fewer than 3 flying bombs hit.
iii)P(x ≥ 3), the probability that at least 3 flying bombs hit.
(Essay)
4.9/5 (31)
In a study of the reaction times of left- and right-handers' reaction times to tones delivered to the right ear, the right-handers' scores were approximately normally distributed with a mean of 210 milliseconds and standard deviation of 40 milliseconds. The mean score for left-handers was 240 ms.
a)Sketch a normal distribution that describes right-handers' reaction times, and locate the mean reaction time for left-handers in this distribution.
b)About what proportion of right-handers reaction times would be "better" (i.e. smaller) than the mean reaction time for left-handers?
(Essay)
4.8/5 (30)
The sales of a newsmagazine vary from week to week, depending on the importance of the news of the previous week. From empirical data over many years, the following distribution of sales (rounded to the nearest million) has been carefully constructed. What are the mean and standard deviation of this distribution? 
(Essay)
4.8/5 (34)
Let z denote a random variable having a standard normal distribution. Determine each of the following probabilities.
a)P(z < 1.28)
b)P(z < −1.05)
c)P(z > −2.51)
d)P(−1.30 < z < 1.54)
(Essay)
4.9/5 (33)
In a major study by the statistics classes at Jefferson High School, parking spaces were examined for compliance with the requirement to put money in the meters. Overall, the students found that 80% of metered parking places had meters that had not expired, and 20% had expired. If the traffic officer in charge of ticketing cars with expired meters, and starts at a random location in the City, what is the probability he or she will find an expired meter before the 3rd one?
(Essay)
4.8/5 (43)
A gasoline tank for a certain car is designed to hold 19 gallons of gas. Suppose that the random variable x = actual capacity of a randomly selected tank has a distribution that is well approximated by a normal curve with mean 19.0 gallons and standard deviation 0.2 gallon.
What is the probability that a randomly selected tank will hold at least 18.9 gallons?
(Multiple Choice)
4.9/5 (32)
Let z denote a random variable having a standard normal distribution. Determine each of the following probabilities.
a)P(z < 1.36)
b)P(z < −2.05)
c)P(z > −1.15)
d)P(−1.10 < z < 2.54)
(Essay)
4.8/5 (41)
A gasoline tank for a certain model car is designed to hold 12 gallons of gas. Suppose that the actual capacity of the gas tank in cars of this type is well approximated by a normal distribution with mean 12.0 gallons and standard deviation 0.2 gallons. What is the probability that a randomly selected car of this model will have a gas tank that holds at most 11.7 gallons?
(Essay)
4.9/5 (42)
Using the notation C = continuous and D = discrete, indicate whether each of the random variables are discrete or continuous.
a)The number of defective lights in your school's main hallway
b)The barometric pressure at midnight
c)The number of staples left in a stapler
d)The number of sentences in a short story
e)The average oven temperature during the cooking of a turkey
f)The number of lightning strikes during a thunderstorm
(Essay)
4.8/5 (40)
Suppose that in a certain metropolitan area 18% of all automobiles are equipped with an electric engine. Let  denote the number among of 9 randomly selected automobiles that are equipped with an electric engine. Calculate
  . Let the random variable
  denote the number of passing automobiles that are equipped with an electric engine until you find automobile with another type of engine. Calculate
  .
.
(Multiple Choice)
4.7/5 (39)
At a large university students have either a final exam or a final paper at the end of a course. The table below lists the distribution of the number of final exams that students at the university will take, and their associated probabilities. What are the mean and standard deviation of this distribution? 
(Essay)
4.8/5 (44)
If x is a random variable, and random variable y is defined as follows, y = a + bx, then  .
.
(True/False)
4.9/5 (30)
The density curve for a continuous random variable is shown below. Use this curve to find the following probabilities:
a)P(x < 1)b)P(2 < x < 3)c)P(x is at least 3) 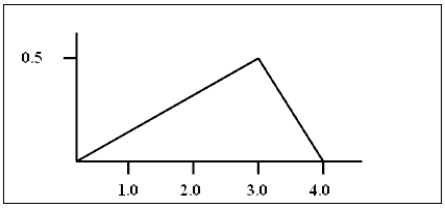 You may use the following area formulas in your calculations:
Area of a rectangle:
A = lw
Area of a trapezoid:
You may use the following area formulas in your calculations:
Area of a rectangle:
A = lw
Area of a trapezoid: 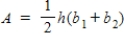 Area of a right triangle:
(Essay)
4.8/5 (37)
At the University of Tough Love, good grades in math are very hard to come by. The grade distribution is shown in the table below:  Suppose three students are to be selected at random. As each is selected their math grades are written down and they are replaced back into the population of students. Three possible outcomes of this experiment are listed below. Calculate the probabilities of these sequences appearing.
a)ABC
b)CCF
c)BBA
Suppose three students are to be selected at random. As each is selected their math grades are written down and they are replaced back into the population of students. Three possible outcomes of this experiment are listed below. Calculate the probabilities of these sequences appearing.
a)ABC
b)CCF
c)BBA
(Essay)
4.8/5 (33)
When driving the nation's highways Anna is known as something of a lead foot. The number of miles per hour over the speed limit varies, but has a mean of 7.5 mph and standard deviation of 2 mph. Unfortunately, the state in which she goes to college adjusts the fines so that the amount of the fine is given by the formula:
F = 10(MPH) + 112,
where F is the amount of the fine, and MPH is the number of miles over the speed limit. Let random variable F be the amount of her fine if she is randomly stopped for speeding.
a)What is the mean of F?
b)What is the standard deviation of F?
(Essay)
4.7/5 (25)
A State Dept. of Education is writing a state-wide math test, and by law must decide how many points will count as a "failing score." The test consists of 50 True/False questions and 40 multiple choice questions with 5 answer options. The total score (TS) will be equal to the number of true/false items correct plus twice the number of multiple-choice items correct. A decision has been made to make the failing score the score that a student would be expected to get if they randomly guessed on all the questions.
a)If a student is randomly guessing, the 50 True/False questions can be regarded as a binomial chance experiment with probability of success equal to 0.50. If we define the random variable T = score from T/F items, what are the mean and standard deviation of T for a random student who is guessing?
b)If a student is randomly guessing, the 40 multiple choice questions can be regarded as a binomial chance experiment with probability of success equal to 0.20. If we define the random variable M = score from MC items, what are the mean and standard deviation of the M for a random student who is guessing?
c)The total score, TS, is a random variable formed by calculating T + 2M. What are the mean and standard deviation of the random variable TS?
d)If a student is randomly guessing on the multiple choice part of the test, what is the probability that the first multiple choice question correct is the 4th multiple choice question?
(Essay)
4.8/5 (35)
Determine the following areas under the standard normal (z) curve.
a)The area under the z curve to the left of 2.53
b)The area under the z curve to the left of −1.33
c)The area under the z curve to the right of 0.76
d)The area under the z curve to the right of −1.47
e)The area under the z curve between −1 and 3
f)The area under the z curve between −2.6 and −1.2
(Essay)
4.9/5 (33)
Filters
- Essay(0)
- Multiple Choice(0)
- Short Answer(0)
- True False(0)
- Matching(0)