Exam 6: Random Variables and Probability Distributions
Exam 1: Collecting Data in Reasonable Ways56 Questions
Exam 2: Graphical Methods for Describing Data Distributions62 Questions
Exam 3: Numerical Methods for Describing Data Distributions37 Questions
Exam 4: Describing Bivariate Numerical Data70 Questions
Exam 5: Probability55 Questions
Exam 6: Random Variables and Probability Distributions72 Questions
Exam 7: An Overview of Statistical Inference - Learning From Data19 Questions
Exam 8: Sampling Variability and Sampling Distributions35 Questions
Exam 9: Estimating a Population Proportion36 Questions
Exam 10: Asking and Answering Questions About a Population Proportion31 Questions
Exam 11: Asking and Answering Questions About the Difference Between Two Proportions42 Questions
Exam 12: Asking and Answering Questions About a Population Mean51 Questions
Exam 13: Asking and Answering Questions About the Difference Between Two Means46 Questions
Exam 14: Learning From Categorical Data36 Questions
Exam 15: Understanding Relationships - Numerical Data Part 243 Questions
Exam 16: Asking and Answering Questions About More Than Two Means25 Questions
Select questions type
Determine the area under the z curve to the right of -1.82
(Multiple Choice)
4.8/5  (40)
(40)
A box contains four slips of paper marked 1, 2, 3, and 4. Two slips are selected without replacement. List the possible values for the following random variable. x= number of slips marked "1"
(Multiple Choice)
4.7/5 (29)
The famous physicist, Ernest Rutherford, was a pioneer in the study of radioactivity using electricity. In one experiment he observed the number of particles reaching a counter during time 1700 intervals of 7.5 seconds each. The number of intervals that had 0 - 4 particles reaching the counter is given in the table below. 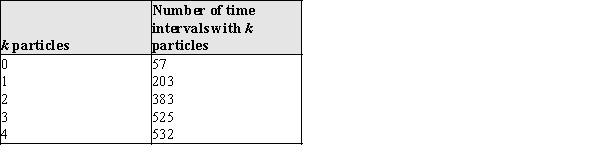 Let the random variable x = number of particles counted in a 7.5 second time period.
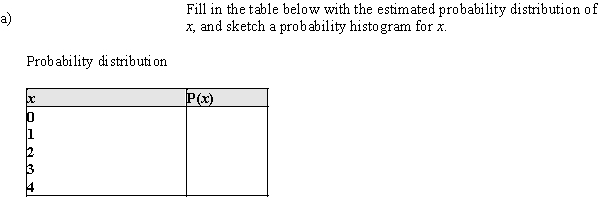
Probability histogram
Probability histogram 
b)Using the estimated probabilities in part (a), estimate the following:
i)P(x = 1), the probability that 1 particle was counted in 7.5 seconds.
ii)P(x < 3), the probability that fewer than 3 particles were counted.
iii)P(x ≥ 3), the probability that at least 3 particles were counted.
b)Using the estimated probabilities in part (a), estimate the following:
i)P(x = 1), the probability that 1 particle was counted in 7.5 seconds.
ii)P(x < 3), the probability that fewer than 3 particles were counted.
iii)P(x ≥ 3), the probability that at least 3 particles were counted.
(Essay)
4.8/5 (36)
Ron rolls a six-sided dice until the number six is shown. What is the probability that he rolls a dice at least three times? What is the probability that he rolls a dice at most four times?
(Multiple Choice)
4.8/5 (29)
Suppose that the random variable  has the probability distribution described by the following density curve.
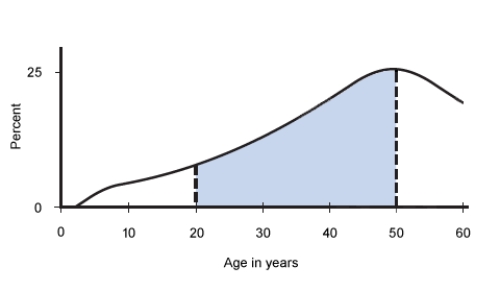
What probability is represented by the shaded area? Suppose the shaded area
What probability is represented by the shaded area? Suppose the shaded area  . Interpret this probability in the context of this problem.
(Multiple Choice)
4.9/5 (32)
Suppose that 73% of the visitors to a certain barbershop have a beard. Let the random variable x denote the number of coming visitors that have a beard until the visitor without beard comes. What is the probability that at most three visitors with beard must come? What is the probability that more than five visitors with beard must come?
(Multiple Choice)
5.0/5 (30)
Seventy-five percent of the computers sold by a certain store are laptops. Among 150 randomly selected computer purchases, what is the approximate probability that at most 125 are laptops? What is the approximate probability that between 100 and 120 (inclusive) are laptops?
(Multiple Choice)
4.8/5 (32)
Suppose that fund-raisers at a university call recent graduates to request donations for campus outreach programs. They report the following information for last year's graduates:  Consider the variable x = amount of donation for a person selected at random from the population of last year's graduates of this university.What is
  ?
?
(Multiple Choice)
4.9/5 (35)
In a major study by the statistics classes at Washington High School, city parking spaces were examined for compliance with the requirement to put money in the parking meters. Overall, the students found that 76% of metered parking places had meters that had not expired, and 24% had meters that were expired. If the traffic officer in charge of ticketing cars with expired meters checks meters at random, what is the probability he or she will find an expired meter before the 3rd one?
(Essay)
4.8/5 (32)
Suppose x is a continuous random variable with the probability distribution shouwn below. 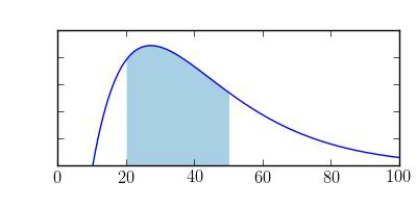 What probability is represented by the shaded area?
(Multiple Choice)
5.0/5 (32)
A normal probability plot suggests that a normal probability model is plausible if there is no obvious pattern in the scatter of points.
(True/False)
4.9/5 (36)
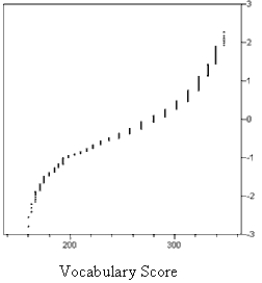
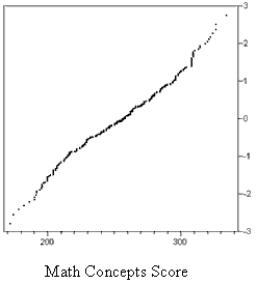
The graphs below are normal probability plots of the vocabulary and math concept scores on a standardized exam for a large sample of students. One of the score distributions is approximately normal. Identify the score distribution that is approximately normal and explain the reason for your choice.
(Essay)
5.0/5 (32)
The distribution of all values of a random variable is called a normal distribution.
(True/False)
4.7/5 (37)
For a variable z that has a standard normal distribution,
a)What is the probability that z < −2.45?
b)What is the probability that z < +1.67?
c)What is the probability that z is between −1.43 and +1.43?
d)What value of z separates the smaller 10% of the standard normal distribution from the larger 90%?
e)What values of −z and +z separate the middle 95% of the standard normal distribution from the extreme 5%?
(Essay)
4.8/5 (39)
A business has five customer service telephone lines. Let x denote the number of lines in use at any given time. Suppose that the probability distribution of x is as follows:  Find the standard deviation of x. Round your answer to two decimal places.
(Multiple Choice)
4.8/5 (40)
Which of the following random variables are discrete? I). the volume of a balloon in liters
II)) the number of helium atoms in a balloon
II)) the number of balloons at a birthday party
(Multiple Choice)
5.0/5 (36)
Determine the following areas under the standard normal (z) curve.
a)The area under the z curve to the left of 1.56
b)The area under the z curve to the left of −2.13
c)The area under the z curve to the right of 0.88
d)The area under the z curve to the right of −1.23
e)The area under the z curve between −2 and 3
f)The area under the z curve between −2.4 and −1.4
(Essay)
4.8/5 (27)
Fifty-five percent of the students at Thomas Jefferson High School use "lunch cards" to charge their lunch, rather than bringing money to school. Assuming that the method of payment (cash or lunch card) for one student is independent of the method of payment for the next student in line, what is the probability of observing the following sequence for the first five students through the lunch line?
Cash, Card, Cash, Card, Cash
(Essay)
4.7/5 (33)
In a certain very large city, the Department of Transportation (D.O.T.) has organized a complex system of bus transportation. In an advertising campaign, citizens are encouraged to use the new "GO-D.O.T!" system and head for the nearest bus stop to be transported to and from the central city. Suppose that at one of the bus stops the amount of time (in minutes) that a commuter must wait for a bus is a uniformly distributed random variable, T. The possible values of T run from 0 minutes to 20 minutes.
a)Sketch the probability distribution of T.
b)What is the probability that a randomly selected commuter will spend more than 7 minutes waiting for GO-D.O.T?
(Essay)
4.9/5 (38)
Filters
- Essay(0)
- Multiple Choice(0)
- Short Answer(0)
- True False(0)
- Matching(0)