Exam 15: Understanding Relationships - Numerical Data Part 2
Exam 1: Collecting Data in Reasonable Ways56 Questions
Exam 2: Graphical Methods for Describing Data Distributions62 Questions
Exam 3: Numerical Methods for Describing Data Distributions37 Questions
Exam 4: Describing Bivariate Numerical Data70 Questions
Exam 5: Probability55 Questions
Exam 6: Random Variables and Probability Distributions72 Questions
Exam 7: An Overview of Statistical Inference - Learning From Data19 Questions
Exam 8: Sampling Variability and Sampling Distributions35 Questions
Exam 9: Estimating a Population Proportion36 Questions
Exam 10: Asking and Answering Questions About a Population Proportion31 Questions
Exam 11: Asking and Answering Questions About the Difference Between Two Proportions42 Questions
Exam 12: Asking and Answering Questions About a Population Mean51 Questions
Exam 13: Asking and Answering Questions About the Difference Between Two Means46 Questions
Exam 14: Learning From Categorical Data36 Questions
Exam 15: Understanding Relationships - Numerical Data Part 243 Questions
Exam 16: Asking and Answering Questions About More Than Two Means25 Questions
Select questions type
When the four basic assumptions for a simple linear regression model are satisfied,
a)What is μb equal to?
b)What is σb equal to?
c)What is the shape of the sampling distribution of b?
d)What is the probability distribution of the standardized variable,  ?
?
(Essay)
4.8/5  (32)
(32)
A study was carried out to investigate the relationship between x = the number of components needing repair and y = the time of the service call (in minutes) for a computer repair company. The number of components and the service times for a random sample of 20 service calls were used to fit a simple linear regression model. Partial computer output is shown below. ______________________________________________________________
The regression equation is Time = 32.441 + 11.6205 Number 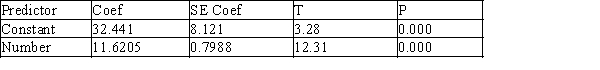
S=19.058, R-Sq=91.3%, R-Sq(adj)=90.0%
______________________________________________________________
One of the numbers in the above computer output indicates the percentage of the observed variation in the service call times that can be explained by the linear relationship between service call time and number of components needing repair.
What is the value of this number?
(Multiple Choice)
4.8/5 (32)
If there is no evidence of a linear relationship between x and y, what decision will be made in a test of  ?
?
(Multiple Choice)
4.8/5 (26)
Filters
- Essay(0)
- Multiple Choice(0)
- Short Answer(0)
- True False(0)
- Matching(0)