Exam 15: Understanding Relationships - Numerical Data Part 2
Exam 1: Collecting Data in Reasonable Ways56 Questions
Exam 2: Graphical Methods for Describing Data Distributions62 Questions
Exam 3: Numerical Methods for Describing Data Distributions37 Questions
Exam 4: Describing Bivariate Numerical Data70 Questions
Exam 5: Probability55 Questions
Exam 6: Random Variables and Probability Distributions72 Questions
Exam 7: An Overview of Statistical Inference - Learning From Data19 Questions
Exam 8: Sampling Variability and Sampling Distributions35 Questions
Exam 9: Estimating a Population Proportion36 Questions
Exam 10: Asking and Answering Questions About a Population Proportion31 Questions
Exam 11: Asking and Answering Questions About the Difference Between Two Proportions42 Questions
Exam 12: Asking and Answering Questions About a Population Mean51 Questions
Exam 13: Asking and Answering Questions About the Difference Between Two Means46 Questions
Exam 14: Learning From Categorical Data36 Questions
Exam 15: Understanding Relationships - Numerical Data Part 243 Questions
Exam 16: Asking and Answering Questions About More Than Two Means25 Questions
Select questions type
The residual plot below indicates that one or more of assumptions of the linear regression model may not be met. Which of the following is a reasonable conclusion based on this residual plot? 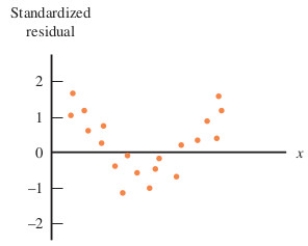
(Multiple Choice)
4.9/5  (28)
(28)
The Iowa Tests of Educational Development are given each year to students around the country. Let x = the previous year's math scores and y = the current year's math scores for a sample of current sophomores who took the test both years.
b
= estimated slope of the regression line = 0.9
a
= estimated y intercept of the regression line = 35.0
a)What is the equation of the estimated regression line?
b)On the graph below, sketch the estimated regression line using the information above. Be sure to label and scale your axes correctly.  c)For a students with a score of 250 the previous year, what is the predicted score for the current year?
d)What is the average difference in math score that is associated with a 10-point difference in the previous year's math score?
e)The value of r2 is 0.74; interpret r2 in the context of this problem.
f)The value of se is 20.5. Interpret se in the context of this problem.
c)For a students with a score of 250 the previous year, what is the predicted score for the current year?
d)What is the average difference in math score that is associated with a 10-point difference in the previous year's math score?
e)The value of r2 is 0.74; interpret r2 in the context of this problem.
f)The value of se is 20.5. Interpret se in the context of this problem.
(Essay)
4.9/5 (38)
The general form of a probabilistic model is y = deterministic function + random deviation.
(True/False)
4.9/5 (42)
Use the scatterplot below to answer the following question: 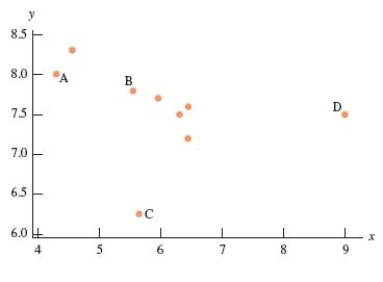 When a linear model is fit to the data, which of the following can be stated with the greatest confidence?
(Multiple Choice)
4.8/5 (39)
A study was carried out to investigate the relationship between x = the number of components needing repair and y = the time of the service call (in minutes) for a computer repair company. The number of components and the service times for a random sample of 20 service calls were used to fit a simple linear regression model. Partial computer output is shown below. ______________________________________________________________
The regression equation is Time = 32.441 + 11.6205 Number 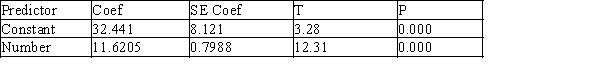 S=19.058, R-Sq=91.3%, R-Sq(adj)=90.0%
______________________________________________________________
One of the numbers in the above computer output indicates the magnitude of a typical difference between an observed service time and the service call time predicted by the linear model.
What is the value of this number?
S=19.058, R-Sq=91.3%, R-Sq(adj)=90.0%
______________________________________________________________
One of the numbers in the above computer output indicates the magnitude of a typical difference between an observed service time and the service call time predicted by the linear model.
What is the value of this number?
(Multiple Choice)
4.9/5 (32)
As part of a study of the swimming speed of sharks, a random sample of 18 lemon sharks (Triakis semifasciata) were observed in a laboratory sea tunnel. Body lengths and maximum sustainable swimming speeds ("MSSS," reported in body lengths per second) were measured for each shark. The computer output from a regression with y = MSSS and x = body length is given below.
Linear Fit 
Summary of Fit
RSquare 0.526395
RSquare Adj 0.496794
S 0)272031
Mean of Response 1.24
N Observations 18
Analysis of Variance
Source DF Sum of Squares Mean Square F Ratio
Model 1 1.3159870 1.31599 17.7834
Error 16 1.1840130 0.07400 Prob > F
Total 17 2.5000000 0.0007*
Parameter Estimates
Term Estimate Std Error t Ratio Prob > |t|
Intercept 1.8928955 0.167575 11.30 < 0.0001*
Length(cm) -0.010428 0.002473 -4.22 0.0007*
The null hypothesis is that there is no linear relationship between body length and maximum sustainable swimming rate. At the 0.05 level of significance, should the null hypothesis be rejected? Assume all the proper conditions are met for applying a linear regression analysis.
(Multiple Choice)
5.0/5 (36)
The computer output given below shows a regression of Science Knowledge vs. Reading Comprehension scores for a random sample of sophomores. 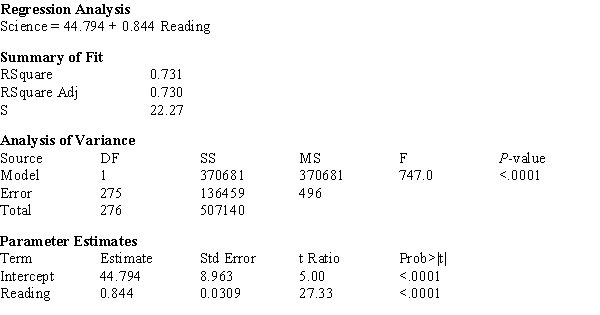
a)What is the estimated regression line?
b)What is the calculated value of sb?
b)What is the calculated value of se?
d)What is the calculated value of the t-ratio for the Model Utility Test?
e)Construct a 95% confidence interval for β.
a)What is the estimated regression line?
b)What is the calculated value of sb?
b)What is the calculated value of se?
d)What is the calculated value of the t-ratio for the Model Utility Test?
e)Construct a 95% confidence interval for β.
(Essay)
4.8/5 (35)
A random sample of steelhead trout was selected; the length of the trout in inches and the weight of the trout in pounds were measured. Fitting the simple linear regression model gave the estimated regression equation 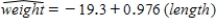 .
a)How would you interpret b = 0.976?
b)Substituting x = 30 gives
.
a)How would you interpret b = 0.976?
b)Substituting x = 30 gives  = 9.98. Give two different interpretations of this number.
c)What happens if you predict the weight of an 18-inch trout? In a few sentences, explain why do you think this has occurred.
d)The value of r2 is not presented here, but explain how you would interpret r2 in the context of this problem.
= 9.98. Give two different interpretations of this number.
c)What happens if you predict the weight of an 18-inch trout? In a few sentences, explain why do you think this has occurred.
d)The value of r2 is not presented here, but explain how you would interpret r2 in the context of this problem.
(Essay)
4.9/5 (30)
In a study of gender-typing of toys, parents and non-parents were asked to rate the gender appropriateness of toys on a scale of 1 (Definitely for girls) to 5 (Definitely for boys). The investigators did a regression analysis of the parents mean scores vs. the non-parents mean scores for each toy. A computer-generated normal probability plot of the residuals is shown below.
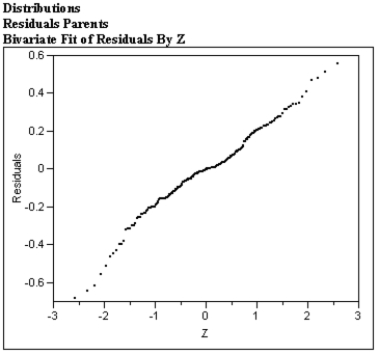
Write a brief paragraph describing the plot. Based on your description recommend to the investigators whether or not the appropriate assumption is met for simple linear regression.
Write a brief paragraph describing the plot. Based on your description recommend to the investigators whether or not the appropriate assumption is met for simple linear regression.
(Essay)
4.8/5 (36)
A veterinary graduate student is studying the relationship between the weight of one year-old golden retrievers in pounds (y) and the amount of dog food the dog is fed each day in pounds (x). A random sample of 10 golden retrievers yielded the following data and summary statistics. 
a)Write the estimated regression line below.
b)On the graph below, sketch the sample regression line using the information above. Be sure to label and scale your axes correctly.
a)Write the estimated regression line below.
b)On the graph below, sketch the sample regression line using the information above. Be sure to label and scale your axes correctly.  c)What is your estimate of the average change in weight associated with a 1-pound increase in daily intake of dog food?
d)What weight would you predict for a randomly selected golden retriever who is fed 1.2 pounds of dog food per day?
e)The value of se is 4.860. Interpret se in the context of this problem.
c)What is your estimate of the average change in weight associated with a 1-pound increase in daily intake of dog food?
d)What weight would you predict for a randomly selected golden retriever who is fed 1.2 pounds of dog food per day?
e)The value of se is 4.860. Interpret se in the context of this problem.
(Essay)
4.9/5 (39)
The computer output given below shows a regression of Social Studies Concepts vs. Reading Comprehension scores for a random sample of sophomores. 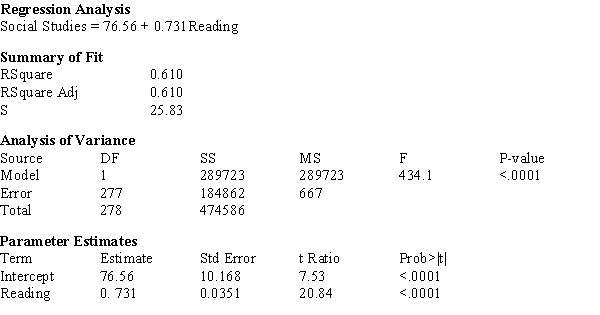 a)What is the estimated regression line?
b)What is the calculated value of sb?
b)What is the calculated value of se?
d)What is the calculated value of the t-ratio for the Model Utility Test?
e)Construct a 95% confidence interval for β.
a)What is the estimated regression line?
b)What is the calculated value of sb?
b)What is the calculated value of se?
d)What is the calculated value of the t-ratio for the Model Utility Test?
e)Construct a 95% confidence interval for β.
(Essay)
4.7/5 (28)
The expected change in the value of y for one unit change in x is α.
(True/False)
4.9/5 (33)
What are the four "Basic Assumptions" of the simple linear regression model?
(Essay)
4.9/5 (36)
In a random sample of large cities around the world, the ozone level (in parts per million) and the population (in millions) were measured. Fitting the simple linear regression model gave the estimated regression equation 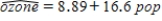 .
a)How would you interpret b = 16.6?
b)Substituting x = 3 gives
.
a)How would you interpret b = 16.6?
b)Substituting x = 3 gives  = 58.69. Give two different interpretations of this number.
c)Do you think this equation should be used for predicting ozone in small towns in Iowa? Explain your response in a few sentences.
d)The value of r2 is not presented here, but explain how you would interpret r2 in the context of this problem.
= 58.69. Give two different interpretations of this number.
c)Do you think this equation should be used for predicting ozone in small towns in Iowa? Explain your response in a few sentences.
d)The value of r2 is not presented here, but explain how you would interpret r2 in the context of this problem.
(Essay)
4.9/5 (38)
The estimated standard deviation, se, has n − 1 degrees freedom.
(True/False)
4.8/5 (41)
If there is a negative linear relationship between two variables x and y, which of the following must be true of β, the slope of the population regression line?
(Multiple Choice)
4.8/5 (32)
The estimated mean value of y is a + bx* when x has the value x*.
(True/False)
4.9/5 (35)
The computer output given below shows a regression of Body Mass (g) vs. Wing Length (mm) for sphinx moths. 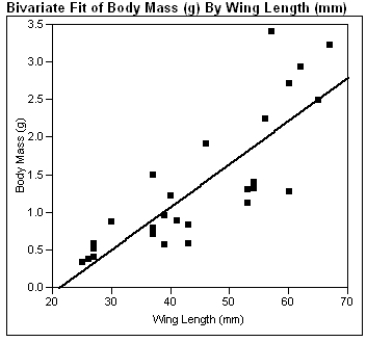
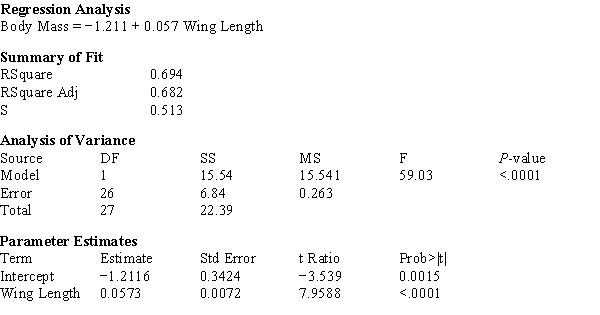 a)What is the estimated regression line?
b)What is the calculated value of sb?
c)What is the calculated value of se?
d)In a few sentences, interpret se in the context of this problem.
e)Using the computer output above, perform the Model Utility Test at the .05 level of significance.
f)Construct a 95% confidence interval for β.
a)What is the estimated regression line?
b)What is the calculated value of sb?
c)What is the calculated value of se?
d)In a few sentences, interpret se in the context of this problem.
e)Using the computer output above, perform the Model Utility Test at the .05 level of significance.
f)Construct a 95% confidence interval for β.
(Essay)
4.8/5 (43)
The scatter plot and residual plot shown below are from a regression analysis of Prehistoric Native American projectile points. The lengths of the projectiles were regressed on the width of the projectile points. 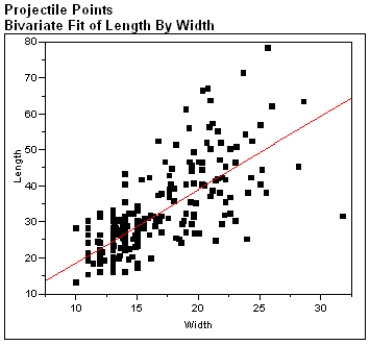
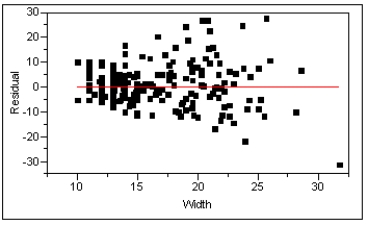 Using these plots categorize each of the Basic Assumptions of the simple linear regression model as one of the following:
a)Not checkable
b)Checked and met
c)Checked and not met
For all assumptions checked, explain what aspect of the graphs led you to your conclusion that the assumption was met or not met.
Using these plots categorize each of the Basic Assumptions of the simple linear regression model as one of the following:
a)Not checkable
b)Checked and met
c)Checked and not met
For all assumptions checked, explain what aspect of the graphs led you to your conclusion that the assumption was met or not met.
(Essay)
4.9/5 (27)
Filters
- Essay(0)
- Multiple Choice(0)
- Short Answer(0)
- True False(0)
- Matching(0)