Exam 10: Asking and Answering Questions About a Population Proportion
Exam 1: Collecting Data in Reasonable Ways56 Questions
Exam 2: Graphical Methods for Describing Data Distributions62 Questions
Exam 3: Numerical Methods for Describing Data Distributions37 Questions
Exam 4: Describing Bivariate Numerical Data70 Questions
Exam 5: Probability55 Questions
Exam 6: Random Variables and Probability Distributions72 Questions
Exam 7: An Overview of Statistical Inference - Learning From Data19 Questions
Exam 8: Sampling Variability and Sampling Distributions35 Questions
Exam 9: Estimating a Population Proportion36 Questions
Exam 10: Asking and Answering Questions About a Population Proportion31 Questions
Exam 11: Asking and Answering Questions About the Difference Between Two Proportions42 Questions
Exam 12: Asking and Answering Questions About a Population Mean51 Questions
Exam 13: Asking and Answering Questions About the Difference Between Two Means46 Questions
Exam 14: Learning From Categorical Data36 Questions
Exam 15: Understanding Relationships - Numerical Data Part 243 Questions
Exam 16: Asking and Answering Questions About More Than Two Means25 Questions
Select questions type
One criticism of reading comprehension tests is that while they may measure reading comprehension, they also measure other factors not related to reading comprehension. A reading comprehension (RC) test on a major college entrance exam provides short English prose passages, and the examinees answer a set of multiple-choice items about the passage. To see if particular items measure something other than RC, investigators gave the RC test without the reading passages to a random sample of psychology students. The investigators reasoned that if questions were measuring knowledge or memory rather than just RC, students would answer questions at a higher rate than chance (20%, since there were 5 choices for each question.)
Suppose that on one question, 30 out of 100 examinees answered the question correctly. Is this sufficient evidence that students are using more than just reading comprehension to answer this question? Test the relevant hypothesis using α = 0.05.
(Essay)
4.8/5  (42)
(42)
For tests of hypotheses about μ, β decreases as the sample size increases if the level of significance stays the same.
(True/False)
4.8/5 (40)
Which of the following specify legitimate pairs of null and alternative hypotheses?
(Multiple Choice)
4.8/5 (43)
Explain in your own words the distinction between a null and alternative hypothesis.
(Essay)
4.8/5 (33)
Assuming a random sample from a large population, for which of the following null hypotheses and sample sizes is the large-sample z test appropriate?
(Multiple Choice)
5.0/5 (51)
The power of a test is the probability of failing to reject the null hypothesis.
(True/False)
4.8/5 (38)
As children grow they develop what is known as "representational insight," a connection between an object and a symbol for that object. A random sample of youngsters 24-months old were shown a video of someone putting a toy under 1 of 4 randomly placed boxes in a room familiar to the child. They were then taken to the room, and asked to "find the toy." The investigators reasoned that a child with representational insight should pick the correct box on the first try. If the children were to overturn the boxes randomly, they would find the toy on the first turn 25% of the time. Thirty children out of 57 subjects found the toy by turning over the correct box on the first try.
Does this sample provide sufficient evidence that the proportion of 24-month old children who choose the correct box on the first try is greater than 0.25? Use a significance level of α = 0.05 to test the appropriate hypothesis.
(Essay)
4.9/5 (33)
When performing tests of hypotheses, there are assumptions that must be met in order for the test to be appropriate. For the test of a hypothesis about a population proportion, describe how you would check the assumptions.
(Essay)
4.9/5 (30)
Researchers conducted a survey of 326 dog owners selected randomly and established that that 37% of the people interviewed take the dog with them on trips. You would like to use this information to estimate the proportion of all dog owners who take the dog with them on trips. Answer the following four key questions and indicate whether the method that you would consider would be a large-sample hypothesis test for a population proportion. 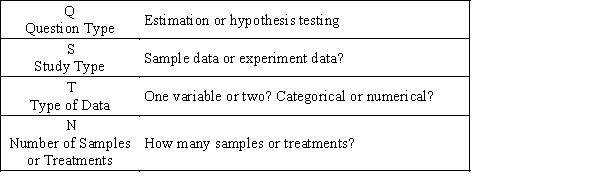
(Multiple Choice)
4.9/5 (34)
The level of significance of a test is the probability of making a type I error, given that the null hypothesis is true.
(True/False)
4.9/5 (38)
Every year on Groundhog Day (February 2), the famous groundhog Punxsutawney Phil tries to predict whether there will be 6 more weeks of winter.
Suppose that you plan to take a random sample of 23 years and use weather data to determine the proportion of these years the groundhog's prediction was correct.
If the groundhog has a 50-50 chance of making a correct prediction, the spread of the sampling distribution of  for samples of size 23 is:
(Multiple Choice)
4.9/5 (33)
Filters
- Essay(0)
- Multiple Choice(0)
- Short Answer(0)
- True False(0)
- Matching(0)