Exam 2: Methods for Describing Sets of Data
Exam 1: Statistics, Data, and Statistical Thinking74 Questions
Exam 2: Methods for Describing Sets of Data188 Questions
Exam 3: Probability237 Questions
Exam 4: Random Variables and Probability Distributions273 Questions
Exam 5: Sampling Distributions52 Questions
Exam 6: Inferences Based on a Single Sample: Estimation With Confidence Intervals135 Questions
Exam 7: Inferences Based on a Single Sample: 355 Tests of Hypotheses144 Questions
Exam 8: Inferences Based on Two Samples: Confidence Intervals and Tests of Hypotheses102 Questions
Exam 9: Design of Experiments and Analysis of Variance87 Questions
Exam 10: Categorical Data Analysis59 Questions
Exam 11: Simple Linear Regression113 Questions
Exam 12: Multiple Regression and Model Building131 Questions
Exam 13: Methods for Quality Improvement: Statistical Process Control Available on CD89 Questions
Exam 14: Time Series: Descriptive Analyses, Models, and Forecasting Available on CD73 Questions
Exam 15: Nonparametric Statistics Available on CD49 Questions
Select questions type
In a symmetric and mound shaped distribution, we expect the values of the mean, median, and mode to differ greatly from one another.
(True/False)
4.8/5  (35)
(35)
The scores for a statistics test are as follows: 87 76 92 77 92 96 88 85 66 89
79 96 50 98 83 88 82 51 10 69
Create a stem-and-leaf display for the data.
(Essay)
4.8/5 (34)
The table shows the number of each type of car sold in June.
Car Number compact 7,204 sedan 9,089 small SUV 20,418 large SUV 13,691 minivan 15,837 truck 15,350 Total 81,589 a. Construct a relative frequency table for the car sales.
b. Construct a Pareto diagram for the car sales using the class percentages as the heights
of the bars.
(Essay)
4.8/5 (35)
The total points scored by a basketball team for each game during its last season have been summarized in the table below. Which statement following the table must be true? Score Frequency 41-60 3 61-80 8 81-100 12 101-120 7
(Multiple Choice)
4.9/5 (32)
The data below show the types of medals won by athletes representing the United States in the Winter Olympics.
gold gold silver gold bronze silver silver bronze gold silver silver bronze silver gold gold silver silver bronze bronze gold silver gold gold bronze bronze a. Construct a frequency table for the data.
b. Construct a relative frequency table for the data.
c. Construct a frequency bar graph for the data.
(Essay)
4.7/5 (32)
The amount of television viewed by today's youth is of primary concern to Parents Against Watching Television (PAWT). 300 parents of elementary school-aged children were asked to estimate the number of hours per week that their child watches television. The mean and the standard deviation for their responses were 17 and 3, respectively. PAWT constructed a stem-and-leaf display for the data that showed that the distribution of times was a symmetric, mound-shaped distribution. Give an interval where you believe approximately 95% of the television viewing times fell in the distribution.
(Multiple Choice)
4.9/5 (38)
The following data represent the scores of 50 students on a statistics exam. The mean score is 80.02, and the standard deviation is 11.9. 39 51 59 63 66 68 68 69 70 71 71 71 73 74 76 76 76 77 78 79 79 79 79 80 80 82 83 83 83 85 85 86 86 88 88 88 88 89 89 89 90 90 91 91 92 95 96 97 97 98 Find the z-scores for the highest and lowest exam scores.
(Essay)
4.7/5 (39)
A sample of professional golfers was taken and their driving distance (measured as the average distance as their drive off the tee) and driving accuracy (measured as the percentage of fairways that their drives landed in) were recorded. A scatterplot of the variables is shown below. 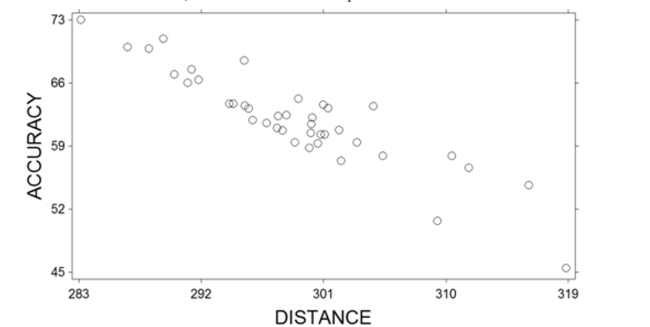 What relationship do these two variables exhibit?
(Multiple Choice)
4.8/5 (29)
Which of the following is not a measure of central tendency?
(Multiple Choice)
4.7/5 (38)
The payroll amounts for all teams in an international hockey league are shown below using a graphical technique from chapter 2 of the text. How many of the hockey team payrolls exceeded $20 million (Note: Assume that no payroll was exactly $20 million)?
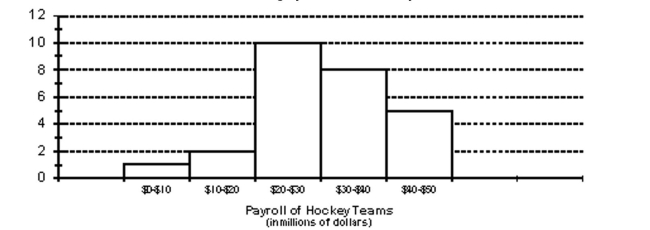
(Multiple Choice)
4.9/5 (38)
Many firms use on-the-job training to teach their employees computer programming. Suppose you work in the personnel department of a firm that just finished training a group of its employees
To program, and you have been requested to review the performance of one of the trainees on the final test that was given to all trainees. The mean of the test scores is 70. Additional information indicated that the median of the test scores was 80. What type of distribution most likely describes the shape of the test scores?
(Multiple Choice)
4.8/5 (38)
The amount spent on textbooks for the fall term was recorded for a sample of five hundred university students. The mean expenditure was calculated to be $500 and the standard deviation of the expenditures was calculated to be $100. Suppose a randomly selected student reported that their textbook expenditure was $700. Calculate the z-score for this student's textbook expenditure.
(Multiple Choice)
4.8/5 (38)
The amount of time workers spend commuting to their jobs each day in a large metropolitan city has a mean of 70 minutes and a standard deviation of 20 minutes. Assuming nothing is known about the shape of the distribution of commuting times, what percentage of these commuting times are between 30 and 110 minutes?
(Multiple Choice)
4.8/5 (36)
At the U.S. Open Tennis Championship a statistician keeps track of every serve that a player hits during the tournament. The statistician reported that the mean serve speed of a particular player was 100 miles per hour (mph) and the standard deviation of the serve speeds was 8 mph. Using the z-score approach for detecting outliers, which of the following serve speeds would represent outliers in the distribution of the player's serve speeds?
Speeds: 72 mph, 108 mph, and 116 mph
(Multiple Choice)
4.8/5 (42)
The data below represent the numbers of absences and the final grades of 15 randomly
selected students from a statistics class. Construct a scattergram for the data. Do you detect
a trend? Student Number of Absences Final Grade as a Percent 1 5 79 2 6 78 3 2 86 4 12 56 5 9 75 6 5 90 7 8 78 8 15 48 9 0 92 10 1 78 11 9 81 12 3 86 13 10 75 14 3 89 15 11 65
(Essay)
4.8/5 (37)
Explain how it can be misleading to report only the mean of a distribution without any measure of the variability.
(Essay)
4.7/5 (34)
The table shows the number of each type of book found at an online auction site during arecent search.
Type of Book Number Children's 51,033 Fiction 141,114 Nonfiction 253,074 Educational 67,252 a. Construct a relative frequency table for the book data.
b. Construct a pie chart for the book data.
(Essay)
4.9/5 (42)
In practice, the population mean µ is used to estimate the sample mean .
(True/False)
4.9/5 (39)
By law, a box of cereal labeled as containing 36 ounces must contain at least 36 ounces of cereal. The machine filling the boxes produces a distribution of fill weights with a mean equal to the setting on the machine and with a standard deviation equal to 0.02 ounce. To ensure that most of the boxes contain at least 36 ounces, the machine is set so that the mean fill per box is 36.06 ounces.
Assuming nothing is known about the shape of the distribution, what can be said about the proportion of cereal boxes that contain less than 36 ounces.
(Multiple Choice)
4.9/5 (37)
Filters
- Essay(0)
- Multiple Choice(0)
- Short Answer(0)
- True False(0)
- Matching(0)