Exam 2: Methods for Describing Sets of Data
Exam 1: Statistics, Data, and Statistical Thinking74 Questions
Exam 2: Methods for Describing Sets of Data188 Questions
Exam 3: Probability237 Questions
Exam 4: Random Variables and Probability Distributions273 Questions
Exam 5: Sampling Distributions52 Questions
Exam 6: Inferences Based on a Single Sample: Estimation With Confidence Intervals135 Questions
Exam 7: Inferences Based on a Single Sample: 355 Tests of Hypotheses144 Questions
Exam 8: Inferences Based on Two Samples: Confidence Intervals and Tests of Hypotheses102 Questions
Exam 9: Design of Experiments and Analysis of Variance87 Questions
Exam 10: Categorical Data Analysis59 Questions
Exam 11: Simple Linear Regression113 Questions
Exam 12: Multiple Regression and Model Building131 Questions
Exam 13: Methods for Quality Improvement: Statistical Process Control Available on CD89 Questions
Exam 14: Time Series: Descriptive Analyses, Models, and Forecasting Available on CD73 Questions
Exam 15: Nonparametric Statistics Available on CD49 Questions
Select questions type
Scatterplots are useful for both qualitative and quantitative data.
(True/False)
4.9/5  (33)
(33)
Box plots are used to detect outliers in qualitative data sets, while z-scores are used to detect outliers in quantitative data sets.
(True/False)
4.9/5 (41)
The speeds of the fastballs thrown by major league baseball pitchers were measured by radar gun. The mean speed was 86 miles per hour. The standard deviation of the speeds was 5 mph. Which of the following speeds would be classified as an outlier?
(Multiple Choice)
4.7/5 (33)
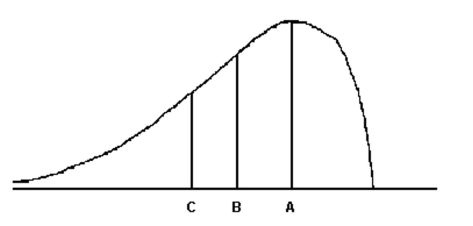 For the distribution drawn here, identify the mean, median, and mode.
(Multiple Choice)
4.9/5 (39)
A recent survey was conducted to compare the cost of solar energy to the cost of gas or electric energy. Results of the survey revealed that the distribution of the amount of the monthly utility bill of a 3-bedroom house using gas or electric energy had a mean of $100 and a standard deviation of $14. Three solar homes reported monthly utility bills of $51, $48, and $56. Which of the following statements is true?
(Multiple Choice)
4.8/5 (32)
If a z-score is 0 or near 0, the measurement is located at or near the mean.
(True/False)
4.8/5 (30)
By law, a box of cereal labeled as containing 24 ounces must contain at least 24 ounces of cereal. The machine filling the boxes produces a distribution of fill weights that is mound-shaped and symmetric, with a mean equal to the setting on the machine and with a standard deviation equal to 0.02 ounce. To ensure that most of the boxes contain at least 24 ounces, the machine is set so that the mean fill per box is 24.06 ounces. What percentage of the boxes do, in fact, contain at least 24 ounces?
(Essay)
4.7/5 (36)
Which of the graphical techniques below can be used to summarize qualitative data?
(Multiple Choice)
4.8/5 (35)
Which of the following statements concerning the box plot and z-score methods for detecting outliers is false?
(Multiple Choice)
4.8/5 (35)
The box plot shown below displays the amount of soda that was poured by a filling machine into 12-ounce soda cans at a local bottling company. 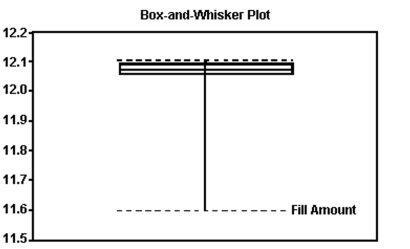 Based on the box plot, what shape do you believe the distribution of the data to have?
(Multiple Choice)
4.7/5 (40)
Which measures variability about the mean, the range or the standard deviation?
(Short Answer)
4.8/5 (32)
In an eye color study, 25 out of 50 people in the sample had brown eyes. In this situation, what does the number .50 represent?
(Multiple Choice)
4.8/5 (33)
On a given day, the price of a gallon of milk had a mean price of $2.16 with a standard deviation of $0.07. A particular food store sold milk for $2.09/gallon. Interpret the z-score for this gas station.
(Multiple Choice)
5.0/5 (34)
A survey was conducted to determine how people feel about the quality of programming available on television. Respondents were asked to rate the overall quality from 0 (no quality at all) to 100 (extremely good quality). The stem-and-leaf display of the data is shown below. Stem 3 1 6 4 0 3 4 7 8 9 9 9 5 0 1 1 2 3 4 5 6 1 2 5 6 6 7 1 4 8 9 5 What percentage of the respondents rated overall television quality as very good (regarded as ratings of 80 and above)?
(Multiple Choice)
4.7/5 (43)
What number is missing from the table? Grades on Test Frequency Relative Frequency A 6 .24 B 7 C 9 .36 D 2 .08 F 1 .04
(Multiple Choice)
4.9/5 (36)
One of the questions posed to a sample of 286 incoming freshmen at a large public university was, "Do you have any tattoos?" Their responses are shown below in the pie chart. Please note that the values shown represent the number of responses in each category. 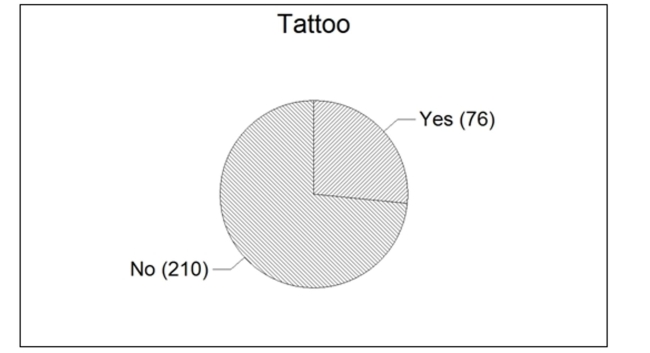 Based on the responses shown in the pie chart, what percentage of the freshmen responded with
"Yes?"
Based on the responses shown in the pie chart, what percentage of the freshmen responded with
"Yes?"
(Multiple Choice)
4.8/5 (40)
The amount spent on textbooks for the fall term was recorded for a sample of five hundred university students. The mean expenditure was calculated to be $500 and the median expenditure was calculated to be $425. Which of the following interpretations of the mean is correct?
(Multiple Choice)
4.8/5 (34)
Explain how stretching the vertical axis of a histogram can be misleading.
(Essay)
4.8/5 (35)
Filters
- Essay(0)
- Multiple Choice(0)
- Short Answer(0)
- True False(0)
- Matching(0)