Exam 2: Methods for Describing Sets of Data
Exam 1: Statistics, Data, and Statistical Thinking74 Questions
Exam 2: Methods for Describing Sets of Data188 Questions
Exam 3: Probability237 Questions
Exam 4: Random Variables and Probability Distributions273 Questions
Exam 5: Sampling Distributions52 Questions
Exam 6: Inferences Based on a Single Sample: Estimation With Confidence Intervals135 Questions
Exam 7: Inferences Based on a Single Sample: 355 Tests of Hypotheses144 Questions
Exam 8: Inferences Based on Two Samples: Confidence Intervals and Tests of Hypotheses102 Questions
Exam 9: Design of Experiments and Analysis of Variance87 Questions
Exam 10: Categorical Data Analysis59 Questions
Exam 11: Simple Linear Regression113 Questions
Exam 12: Multiple Regression and Model Building131 Questions
Exam 13: Methods for Quality Improvement: Statistical Process Control Available on CD89 Questions
Exam 14: Time Series: Descriptive Analyses, Models, and Forecasting Available on CD73 Questions
Exam 15: Nonparametric Statistics Available on CD49 Questions
Select questions type
The mean of a data set is 36.71, and the sample standard deviation s is 3.22. Find the interval representing measurements within one standard deviation of the mean.
(Multiple Choice)
4.8/5  (43)
(43)
A study was designed to investigate the effects of two variables - (1) a student's level of mathematical anxiety and (2) teaching method - on a student's achievement in a mathematics course. Students who had a low level of mathematical anxiety were taught using the traditional expository method. These students obtained a mean score of 350 with a standard deviation of 40 on a standardized test. Assuming a mound-shaped and symmetric distribution, what percentage of scores exceeded 270?
(Multiple Choice)
4.9/5 (37)
Fill in the blank. __________ is a method of interpreting the standard deviation of data that have a mound-shaped, symmetric distribution.
(Multiple Choice)
4.8/5 (33)
The following data represent the scores of 50 students on a statistics exam. The mean score is 80.02, and the standard deviation is 11.9. 39 51 59 63 66 68 68 69 70 71 71 71 73 74 76 76 76 77 78 79 79 79 79 80 80 82 83 83 83 85 85 86 86 88 88 88 88 89 89 89 90 90 91 91 92 95 96 97 97 98 What percentage of the scores lies within one standard deviation of the mean? two standard deviations of the mean? three standard deviations of the mean? Based on these percentages, do you believe that the distribution of scores is mound-shaped and symmetric? Explain.
(Essay)
4.9/5 (36)
Both Chebyshev's rule and the empirical rule guarantee that no data item will be more than four standard deviations from the mean.
(True/False)
4.8/5 (31)
Use a graphing calculator or software to construct a box plot for the following data set. 12 18 14 17 19 16 14 18 15 17 11 13 14 11 16 18 15 13 17 15 14 19 12 16 17
(Essay)
5.0/5 (41)
Summary information is given for the weights (in pounds) of 1000 randomly sampled tractor trailers. MIN: 3996 25\%: 5596 MAX: 10,596 75\%: 8596 AVE: 6996 Std. Dev.: 1400 Find the percentage of tractor trailers with weights between 5596 and 8596 pounds.
(Multiple Choice)
4.7/5 (41)
An annual survey sent to retail store managers contained the question "Did your store suffer any losses due to employee theft?" The responses are summarized in the table for two years. Compare the responses for the two years using side-by-side bar charts. What inferences can be made from the charts?
Employee Theft Percentage in year 1 Percentage in year 2 Yes 34 23 No 51 68 Don't know 15 9 Totals 100 100
(Essay)
4.8/5 (41)
At the U.S. Open Tennis Championship a statistician keeps track of every serve that a player hits during the tournament. The statistician reported that the mean serve speed of a particular player was 97 miles per hour (mph) and the standard deviation of the serve speeds was 13 mph. Assume that the statistician also gave us the information that the distribution of the serve speeds was mound-shaped and symmetric. What proportion of the player's serves was between 110 mph and 136 mph?
(Multiple Choice)
4.8/5 (39)
The calculator screens summarize a data set. 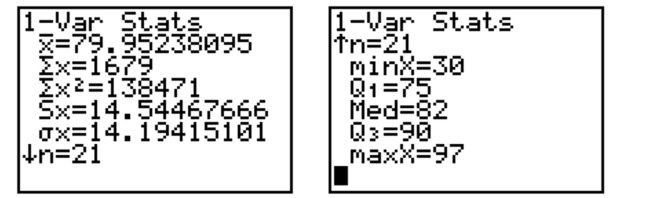 a. How many data items are in the set?
b. What is the sum of the data?
c. Identify the mean, median, and mode, if possible.
a. How many data items are in the set?
b. What is the sum of the data?
c. Identify the mean, median, and mode, if possible.
(Essay)
4.7/5 (36)
The z-score for a value x is -2.5. State whether the value of x lies above or below the mean and by how many standard deviations.
(Essay)
4.8/5 (36)
For a given data set, the lower quartile is 45, the median is 50, and the upper quartile is 57.
The minimum value in the data set is 32, and the maximum is 81.
a. Find the interquartile range.
b. Find the inner fences.
c. Find the outer fences.
d. Is either of the minimum or maximum values considered an outlier? Explain.
(Essay)
4.7/5 (36)
What characteristic of a Pareto diagram distinguishes it from other bar graphs?
(Essay)
4.9/5 (35)
The ages of five randomly chosen professors are 58, 61, 62, 69, and 44. Calculate the sample variance of these ages.
(Essay)
4.9/5 (38)
An outlier in a data set may have a simple explanation such as a scale was not working properly or the researcher inverted the digits of a number when recording a measurement.
(True/False)
4.8/5 (28)
A sample of 100 e-mail users were asked whether their primary e-mail account was a free account, an institutional (school or work) account, or an account that they pay for personally. Identify the classes for the resulting data.
(Essay)
4.7/5 (32)
The distribution of scores on a test is mound-shaped and symmetric with a mean score of 78. If 68% of the scores fall between 72 and 84, which of the following is most likely to be the standard deviation of the distribution?
(Multiple Choice)
4.7/5 (34)
The mean x of a data set is 18, and the sample standard deviation s is 2. Explain what the interval (12, 24) represents.
(Essay)
5.0/5 (39)
A Pareto diagram is a pie chart where the slices are arranged from largest to smallest in a counterclockwise direction.
(True/False)
4.8/5 (36)
Filters
- Essay(0)
- Multiple Choice(0)
- Short Answer(0)
- True False(0)
- Matching(0)