Exam 2: Methods for Describing Sets of Data
Exam 1: Statistics, Data, and Statistical Thinking74 Questions
Exam 2: Methods for Describing Sets of Data188 Questions
Exam 3: Probability237 Questions
Exam 4: Random Variables and Probability Distributions273 Questions
Exam 5: Sampling Distributions52 Questions
Exam 6: Inferences Based on a Single Sample: Estimation With Confidence Intervals135 Questions
Exam 7: Inferences Based on a Single Sample: 355 Tests of Hypotheses144 Questions
Exam 8: Inferences Based on Two Samples: Confidence Intervals and Tests of Hypotheses102 Questions
Exam 9: Design of Experiments and Analysis of Variance87 Questions
Exam 10: Categorical Data Analysis59 Questions
Exam 11: Simple Linear Regression113 Questions
Exam 12: Multiple Regression and Model Building131 Questions
Exam 13: Methods for Quality Improvement: Statistical Process Control Available on CD89 Questions
Exam 14: Time Series: Descriptive Analyses, Models, and Forecasting Available on CD73 Questions
Exam 15: Nonparametric Statistics Available on CD49 Questions
Select questions type
The total points scored by a basketball team for each game during its last season have been summarized in the table below. Identify the modal class of the distribution of scores.
Score Frequency 41-60 3 61-80 8 81-100 12 101-120 7
(Essay)
4.8/5  (47)
(47)
In general, the sample mean is a better estimator of the population mean for larger sample sizes.
(True/False)
4.7/5 (45)
At the U.S. Open Tennis Championship a statistician keeps track of every serve that a player hits during the tournament. The statistician reported that the mean serve speed of a particular player was 96 miles per hour. Suppose that the statistician indicated that the serve speed distribution was skewed to the left. Which of the following values is most likely the value of the median serve speed?
(Multiple Choice)
4.8/5 (42)
The box plot shown below was constructed for the amount of soda that was poured by a filling machine into 12-ounce soda cans at a local soda bottling company.
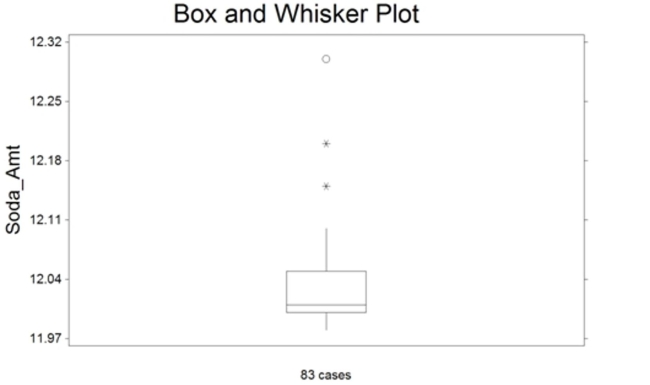 We see that one soda can received 12.30 ounces of soda on the plot above. Based on the box plot
Presented, how would you classify this observation?
We see that one soda can received 12.30 ounces of soda on the plot above. Based on the box plot
Presented, how would you classify this observation?
(Multiple Choice)
5.0/5 (43)
Explain how it can be misleading to draw the bars in a histogram so that the width of each bar is proportional to its height rather than have all bars the same width.
(Essay)
4.8/5 (31)
Which of the following statements could be an explanation for the presence of an outlier in the data?
(Multiple Choice)
4.9/5 (39)
At the U.S. Open Tennis Championship a statistician keeps track of every serve that a player hits during the tournament. The lower quartile of a particular player's serve speeds was reported to be 99 mph. Which of the following interpretations of this information is correct?
(Multiple Choice)
4.9/5 (43)
The mean and the median are useful measures of central tendency for both qualitative and quantitative data.
(True/False)
4.8/5 (43)
The top speeds for a sample of five new automobiles are listed below. Calculate the standard deviation of the speeds. Round to four decimal places.
195, 100, 165, 130, 145
(Multiple Choice)
4.8/5 (36)
Class relative frequencies must be used, rather than class frequencies or class percentages, when constructing a Pareto diagram.
(True/False)
4.8/5 (35)
Calculate the range of the following data set:
8, 8, 4, 1, 9, 12, 8, 5, 5
(Multiple Choice)
5.0/5 (33)
The sample variance is always greater than the sample standard deviation.
(True/False)
4.8/5 (43)
The data show the total number of medals (gold, silver, and bronze) won by each country winning at least one gold medal in the Winter Olympics. Find the range, sample variance, and sample standard deviation of the numbers of medals won by these countries.
1 2 3 3 4 9 9 11 11 11 14 14 19 22 23 24 25 29
(Essay)
5.0/5 (41)
A sociologist recently conducted a survey of citizens over 60 years of age who have net worths too high to qualify for Medicaid but have no private health insurance. The ages of the 25 uninsured senior citizens were as follows:
68 73 66 76 86 74 61 89 65 90 69 92 76 62 81 63 68 81 70 73 60 87 75 64 82
Find the upper quartile of the data.
(Multiple Choice)
4.8/5 (41)
Parking at a university has become a problem. University administrators are interested in determining the average time it takes a student to find a parking spot. An administrator inconspicuously followed 190 students and recorded how long it took each of them to find a parking spot. The times had a distribution that was skewed to the left. Based on this information, discuss the relationship between the mean and the median for the 190 times collected.
(Essay)
4.9/5 (40)
At the U.S. Open Tennis Championship a statistician keeps track of every serve that a player hits during the tournament. The statistician reported that the mean serve speed of a particular player was 105 miles per hour (mph) and the standard deviation of the serve speeds was 9 mph. If nothing is known about the shape of the distribution, give an interval that will contain the speeds of at least eight-ninths of the player's serves.
(Multiple Choice)
4.8/5 (34)
Which number on the screen below is the sample standard deviation of the data? 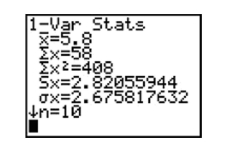
(Multiple Choice)
4.7/5 (26)
Fill in the blank. __________ gives us a method of interpreting the standard deviation of any data set, regardless of the shape of the distribution.
(Multiple Choice)
4.8/5 (31)
A recent survey was conducted to compare the cost of solar energy to the cost of gas or
electric energy. Results of the survey revealed that the distribution of the amount of the monthly utility bill of a 3-bedroom house using gas or electric energy had a mean of $124.00 and a standard deviation of $15.00. Assuming the distribution is mound-shaped and symmetric, would you expect to see a 3-bedroom house using gas or electric energy with a monthly utility bill of $236.50? Explain.
(Essay)
4.8/5 (42)
Filters
- Essay(0)
- Multiple Choice(0)
- Short Answer(0)
- True False(0)
- Matching(0)