Exam 2: Methods for Describing Sets of Data
Exam 1: Statistics, Data, and Statistical Thinking74 Questions
Exam 2: Methods for Describing Sets of Data188 Questions
Exam 3: Probability237 Questions
Exam 4: Random Variables and Probability Distributions273 Questions
Exam 5: Sampling Distributions52 Questions
Exam 6: Inferences Based on a Single Sample: Estimation With Confidence Intervals135 Questions
Exam 7: Inferences Based on a Single Sample: 355 Tests of Hypotheses144 Questions
Exam 8: Inferences Based on Two Samples: Confidence Intervals and Tests of Hypotheses102 Questions
Exam 9: Design of Experiments and Analysis of Variance87 Questions
Exam 10: Categorical Data Analysis59 Questions
Exam 11: Simple Linear Regression113 Questions
Exam 12: Multiple Regression and Model Building131 Questions
Exam 13: Methods for Quality Improvement: Statistical Process Control Available on CD89 Questions
Exam 14: Time Series: Descriptive Analyses, Models, and Forecasting Available on CD73 Questions
Exam 15: Nonparametric Statistics Available on CD49 Questions
Select questions type
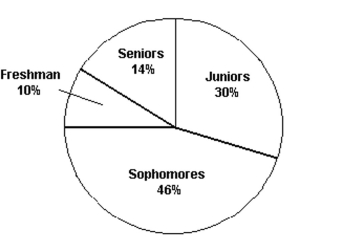 The pie chart shows the classifications of students in a statistics class. What percentage of the class consists of freshman, sophomores, and juniors?
(Multiple Choice)
4.8/5  (39)
(39)
A standardized test has a mean score of 500 points with a standard deviation of 100 points. Five students' scores are shown below.
Which of the students have scores within two standard deviations of the mean?
(Multiple Choice)
4.9/5 (40)
Your teacher announces that the scores on a test have a mean of 83 points with a standard deviation of 4 points, so it is reasonable to expect that you scored at least 70 on the test.
(True/False)
4.9/5 (42)
At the U.S. Open Tennis Championship a statistician keeps track of every serve that a player hits during the tournament. The statistician reported that the mean serve speed of a particular player was 98 miles per hour (mph) and the standard deviation of the serve speeds was 13 mph. Assume that the statistician also gave us the information that the distribution of serve speeds was mound-shaped and symmetric. Find the percentage of serves that were hit faster than 72 mph.
(Essay)
4.8/5 (33)
A small computing center has found that the number of jobs submitted per day to its computers has a distribution that is approximately mound-shaped and symmetric, with a mean of 85 jobs and a standard deviation of 5. Where do we expect approximately 95% of the distribution to fall?
(Multiple Choice)
5.0/5 (40)
For a given data set, which is typically greater, the range or the standard deviation?
(Short Answer)
4.7/5 (39)
Fill in the blank. One advantage of the __________ is that the actual data values are retained in the graphical summarization of the data.
(Multiple Choice)
4.8/5 (39)
A study was designed to investigate the effects of two variables - (1) a student's level of mathematical anxiety and (2) teaching method - on a student's achievement in a mathematics course. Students who had a low level of mathematical anxiety were taught using the traditional expository method. These students obtained a mean score of 470 with a standard deviation of 20 on a standardized test. Assuming no information concerning the shape of the distribution is known, what percentage of the students scored between 430 and 510?
(Multiple Choice)
4.8/5 (30)
The following is a list of 25 measurements: 12 18 14 17 19 16 14 18 15 17 11 13 14 11 16 18 15 13 17 15 14 19 12 16 17 How many of the measurements fall within one standard deviation of the mean?
(Multiple Choice)
4.8/5 (39)
The box plot shown below was constructed for the amount of soda that was poured by a filling machine into 12-ounce soda cans at a local soda bottling company.
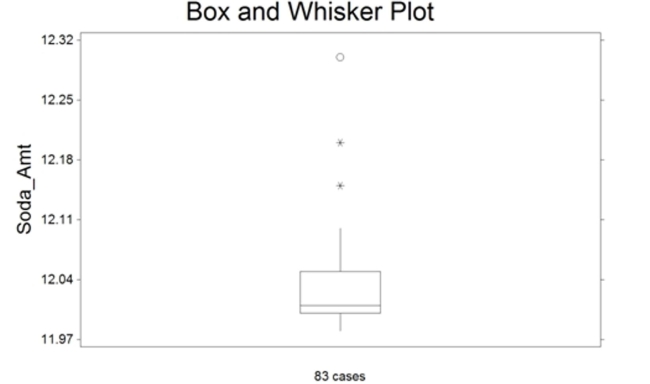 We see that one soda can received 12.15 ounces of soda on the plot above. Based on the box plot presented, how would you classify this observation?
(Multiple Choice)
4.7/5 (33)
At the U.S. Open Tennis Championship a statistician keeps track of every serve that a player hits during the tournament. The statistician reported that the mean serve speed of a particular player was 100 miles per hour (mph) and the standard deviation of the serve speeds was 15 mph. Using the z-score approach for detecting outliers, which of the following serve speeds would represent outliers in the distribution of the player's serve speeds?
Speeds: 50 mph, 80 mph, and 105 mph
(Multiple Choice)
4.9/5 (48)
The scores for a statistics test are as follows: 75 76 62 77 70 92 61 85 95 89
79 67 50 60 85 65 85 73 18 82
Compute the mean score.
(Multiple Choice)
4.7/5 (27)
Which of the following is a measure of the variability of a distribution?
(Multiple Choice)
4.8/5 (36)
Explain how using a scale break on the vertical axis of a histogram can be misleading.
(Essay)
4.8/5 (39)
A larger standard deviation means greater variability in the data.
(True/False)
4.9/5 (35)
A study was designed to investigate the effects of two variables - (1) a student's level of mathematical anxiety and (2) teaching method - on a student's achievement in a mathematics course. Students who had a low level of mathematical anxiety were taught using the traditional expository method. These students obtained a mean score of 310 and a standard deviation of 50 on a standardized test. Find and interpret the z-score of a student who scored 490 on the standardized test.
(Essay)
4.9/5 (25)
The amount spent on textbooks for the fall term was recorded for a sample of five hundred university students. The mean expenditure was calculated to be $500 and the median expenditure was calculated to be $425. Which of the following interpretations of the median is correct?
(Multiple Choice)
4.8/5 (30)
A retail store's customer satisfaction rating is at the 88th percentile. What percentage of retail stores has higher customer satisfaction ratings than this store?
(Short Answer)
4.8/5 (29)
The data show the total number of medals (gold, silver, and bronze) won by each country winning at least one gold medal in the Winter Olympics. Find the mean, median, and mode of the numbers of medals won by these countries.
1 2 3 3 4 9 9 11 11 11 14 14 19 22 23 24 25 29
(Essay)
4.9/5 (46)
The temperature fluctuated between a low of 73°F and a high of 89°F. Which of the following could be calculated using just this information?
(Multiple Choice)
4.8/5 (37)
Filters
- Essay(0)
- Multiple Choice(0)
- Short Answer(0)
- True False(0)
- Matching(0)