Exam 2: Methods for Describing Sets of Data
Exam 1: Statistics, Data, and Statistical Thinking74 Questions
Exam 2: Methods for Describing Sets of Data188 Questions
Exam 3: Probability237 Questions
Exam 4: Random Variables and Probability Distributions273 Questions
Exam 5: Sampling Distributions52 Questions
Exam 6: Inferences Based on a Single Sample: Estimation With Confidence Intervals135 Questions
Exam 7: Inferences Based on a Single Sample: 355 Tests of Hypotheses144 Questions
Exam 8: Inferences Based on Two Samples: Confidence Intervals and Tests of Hypotheses102 Questions
Exam 9: Design of Experiments and Analysis of Variance87 Questions
Exam 10: Categorical Data Analysis59 Questions
Exam 11: Simple Linear Regression113 Questions
Exam 12: Multiple Regression and Model Building131 Questions
Exam 13: Methods for Quality Improvement: Statistical Process Control Available on CD89 Questions
Exam 14: Time Series: Descriptive Analyses, Models, and Forecasting Available on CD73 Questions
Exam 15: Nonparametric Statistics Available on CD49 Questions
Select questions type
In a distribution that is skewed to the right, what is the relationship of the mean, median, and mode?
A) median > mean > mode
B) mode median mode
C) mode mean median
D) mean > median > mode
(Short Answer)
4.9/5  (37)
(37)
A sociologist recently conducted a survey of citizens over 60 years of age who have net worths too high to qualify for Medicaid but have no private health insurance. The ages of the 25 uninsured senior citizens were as follows:
68 73 66 76 86 74 61 89 65 90 69 92 76
62 81 63 68 81 70 73 60 87 75 64 82 Suppose the mean and standard deviation are 74.04 and 9.75, respectively. If we assume that the distribution of ages is mound-shaped and symmetric, what percentage of the respondents will be between 64.29 and 93.54 years old?
(Multiple Choice)
4.9/5 (33)
The amount spent on textbooks for the fall term was recorded for a sample of five university students - $400, $350, $600, $525, and $450. Calculate the value of the sample range for the data.
(Multiple Choice)
4.8/5 (26)
The calculator screens summarize a data set. 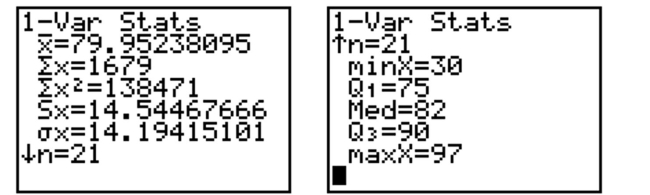 a. Identify the lower and upper quartiles of the data set.
b. Find the interquartile range.
c. Is there reason to suspect that the data may contain an outlier? Explain.
a. Identify the lower and upper quartiles of the data set.
b. Find the interquartile range.
c. Is there reason to suspect that the data may contain an outlier? Explain.
(Essay)
4.8/5 (39)
Given the sample variance of a distribution, explain how to find the standard deviation.
(Essay)
4.9/5 (30)
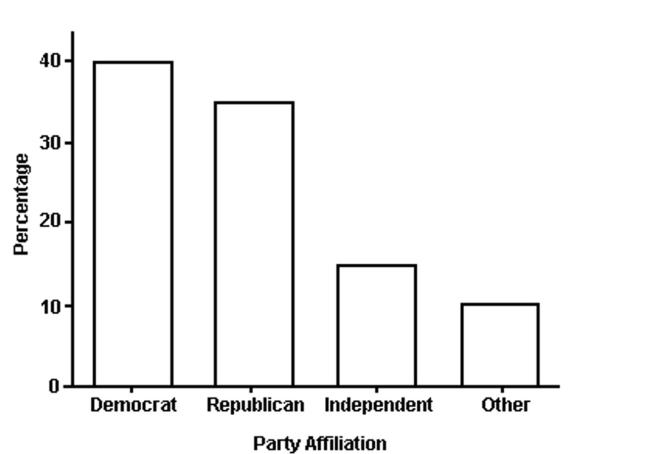 The bar graph shows the political affiliation of 1000 registered U.S. voters. What percentage of the voters belonged to one of the traditional two parties (Democratic or Republican)?
(Multiple Choice)
4.8/5 (32)
In a summary of recent real estate sales, the median home price is given as $325,000. What percentile corresponds to a home price of $325,000?
(Short Answer)
4.8/5 (34)
The output below displays the mean and median for the state high school dropout rates in year 1 and in year 5. Year 1 Year 5 N 51 51 MEAN 28.94 26.53 MEDIAN 27.78 25.64 Interpret the year 5 median dropout rate of 25.64.
(Multiple Choice)
4.8/5 (45)
Filters
- Essay(0)
- Multiple Choice(0)
- Short Answer(0)
- True False(0)
- Matching(0)