Exam 2: Methods for Describing Sets of Data
Exam 1: Statistics, Data, and Statistical Thinking74 Questions
Exam 2: Methods for Describing Sets of Data188 Questions
Exam 3: Probability237 Questions
Exam 4: Random Variables and Probability Distributions273 Questions
Exam 5: Sampling Distributions52 Questions
Exam 6: Inferences Based on a Single Sample: Estimation With Confidence Intervals135 Questions
Exam 7: Inferences Based on a Single Sample: 355 Tests of Hypotheses144 Questions
Exam 8: Inferences Based on Two Samples: Confidence Intervals and Tests of Hypotheses102 Questions
Exam 9: Design of Experiments and Analysis of Variance87 Questions
Exam 10: Categorical Data Analysis59 Questions
Exam 11: Simple Linear Regression113 Questions
Exam 12: Multiple Regression and Model Building131 Questions
Exam 13: Methods for Quality Improvement: Statistical Process Control Available on CD89 Questions
Exam 14: Time Series: Descriptive Analyses, Models, and Forecasting Available on CD73 Questions
Exam 15: Nonparametric Statistics Available on CD49 Questions
Select questions type
A small computing center has found that the number of jobs submitted per day to its computers has a distribution that is approximately mound-shaped and symmetric, with a mean of 93 jobs and a standard deviation of 8. On what percentage of days do the number of jobs submitted exceed 101?
(Essay)
4.9/5  (34)
(34)
In skewed distributions, the mean is the best measure of the center of the distribution since it is least affected by extreme observations.
(True/False)
4.8/5 (34)
When Scholastic Achievement Test scores (SATs) are sent to test-takers, the percentiles associated with scores are also given. Suppose a test-taker scored at the 87th percentile on the verbal part of the test and at the 14th percentile on the quantitative part. Interpret these results.
(Multiple Choice)
4.8/5 (39)
Chebyshev's rule applies to large data sets, while the empirical rule applies to small data sets.
(True/False)
4.9/5 (27)
The following data represent the scores of 50 students on a statistics exam. 39 51 59 63 66 68 68 69 70 71 71 71 73 74 76 76 76 77 78 79 79 79 79 80 80 82 83 83 83 85 85 86 86 88 88 88 88 89 89 89 90 90 91 91 92 95 96 97 97 98
a. Find the lower quartile, the upper quartile, and the median of the scores.
b. Find the interquartile range of the data and use it to identify potential outliers.
c. In a box plot for the data, which scores, if any, would be outside the outer fences?
Which scores, if any, would be outside the inner fences but inside the outer fences?
(Essay)
4.9/5 (33)
The outer fences of a box plot are three standard deviations from the mean.
(True/False)
4.8/5 (33)
A recent survey was conducted to compare the cost of solar energy to the cost of gas or electric energy. Results of the survey revealed that the distribution of the amount of the monthly utility bill of a 3-bedroom house using gas or electric energy had a mean of $104 and a standard deviation of $10. If the distribution can be considered mound-shaped and symmetric, what percentage of homes will have a monthly utility bill of more than $94?
(Multiple Choice)
4.9/5 (40)
The bars in a bar graph can be arranged by height in ascending order from left to right.
(True/False)
4.9/5 (30)
A radio station claims that the amount of advertising each hour has an a mean of 17 minutes and a standard deviation of 2.5 minutes. You listen to the radio station for 1 hour and observe that the amount of advertising time is 11.75 minutes. Based on your observation, what would you infer about the radio station's claim?
(Essay)
4.8/5 (34)
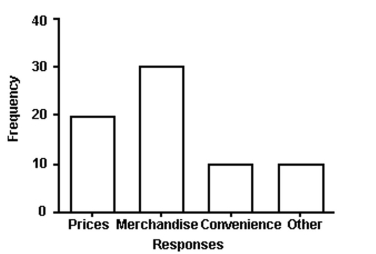 The manager of a store conducted a customer survey to determine why customers shopped at the store. The results are shown in the figure. What proportion of customers responded that merchandise was the reason they shopped at the store?
(Multiple Choice)
4.7/5 (43)
Many firms use on-the-job training to teach their employees computer programming. Suppose you work in the personnel department of a firm that just finished training a group of its employees to program, and you have been requested to review the performance of one of the trainees on the
Final test that was given to all trainees. The mean and standard deviation of the test scores are 82 and 5, respectively. Assuming nothing is known about the distribution, what percentage of test-takers scored above 92?
(Multiple Choice)
4.8/5 (38)
260 randomly sampled college students were asked, among other things, to state their year in school (freshman, sophomore, junior, or senior). The responses are shown in the bar graph below.
How many of the students who responded would be classified as upperclassmen (e.g., juniors or seniors)? 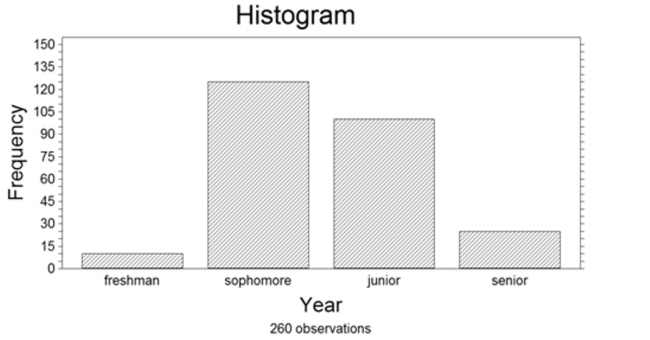
(Multiple Choice)
4.8/5 (38)
The distribution of salaries of professional basketball players is skewed to the right. Which measure of central tendency would be the best measure to determine the location of the center of the distribution?
(Multiple Choice)
4.9/5 (34)
If nothing is known about the shape of a distribution, what percentage of the observations fall within 2 standard deviations of the mean?
(Multiple Choice)
4.9/5 (36)
The z-score uses the quartiles to identify outliers in a data set.
(True/False)
4.9/5 (37)
Given a data set, which of the following is most likely to be the percentage of data within three standard deviations of the mean?
(Multiple Choice)
4.8/5 (38)
A recent survey was conducted to compare the cost of solar energy to the cost of gas or electric energy. Results of the survey revealed that the distribution of the amount of the monthly utility bill of a 3-bedroom house using gas or electric energy had a mean of $90 and a standard deviation of $15. If nothing is known about the shape of the distribution, what percentage of homes will have a monthly utility bill of less than $60?
(Multiple Choice)
4.8/5 (45)
Percentile rankings are of practical value only with large data sets.
(True/False)
4.8/5 (43)
Filters
- Essay(0)
- Multiple Choice(0)
- Short Answer(0)
- True False(0)
- Matching(0)