Exam 2: Methods for Describing Sets of Data
Exam 1: Statistics, Data, and Statistical Thinking73 Questions
Exam 2: Methods for Describing Sets of Data194 Questions
Exam 3: Probability283 Questions
Exam 4: Discrete Random Variables133 Questions
Exam 5: Continuous Random Variables139 Questions
Exam 6: Sampling Distributions47 Questions
Exam 7: Inferences Based on a Single Sample: Estimation With Confidence Intervals124 Questions
Exam 8: Inferences Based on a Single Sample: Tests of Hypothesis140 Questions
Exam 9: Inferences Based on a Two Samples: Confidence Intervals and Tests of Hypotheses94 Questions
Exam 10: Analysis of Variance: Comparing More Than Two Means90 Questions
Exam 11: Simple Linear Regression111 Questions
Exam 12: Multiple Regression and Model Building131 Questions
Exam 13: Categorical Data Analysis60 Questions
Exam 14: Nonparametric Statistics90 Questions
Select questions type
A study was designed to investigate the effects of two variables - (1) a student's level of mathematical anxiety and (2) teaching method - on a student's achievement in a mathematics course. Students who had a low level of mathematical anxiety were taught using the traditional expository method. These students obtained a mean score of 470 with a standard deviation of 50 on a standardized test. Assuming a non-mound-shaped distribution, what percentage of the students scored over 620?
(Multiple Choice)
4.9/5  (37)
(37)
The total points scored by a basketball team for each game during its last season have been summarized in the table below. Score Frequency 41-60 3 61-80 8 81-100 12 101-120 7 a. Explain why you cannot use the information in the table to construct a stem-and-leaf display for the data. b. Construct a histogram for the scores.
(Essay)
4.8/5 (37)
The amount spent on textbooks for the fall term was recorded for a sample of five university students - $400, $350, $600, $525, and $450. Calculate the value of the sample median for the data.
(Multiple Choice)
4.8/5 (42)
The total points scored by a basketball team for each game during its last season have been summarized in the table below. Which statement following the table must be true? Score Frequency 41-60 3 61-80 8 81-100 12 101-120 7
(Multiple Choice)
4.8/5 (40)
The data below represent the numbers of absences and the final grades of 15 randomly selected students from a statistics class. Construct a scattergram for the data. Do you detect a trend? Student Number of Absences Final Grade as a Percent 1 5 79 2 6 78 3 2 86 4 12 56 5 9 75 6 5 90 7 8 78 8 15 48 9 0 92 10 1 78 11 9 81 12 3 86 13 10 75 14 3 89 15 11 65
(Essay)
4.9/5 (35)
During one recent year, U.S. consumers redeemed 6.79 billion manufacturers' coupons and saved themselves $2.56 billion. Calculate and interpret the mean savings per coupon.
(Multiple Choice)
4.8/5 (33)
Either vertical or horizontal bars can be used when constructing a bar graph.
(True/False)
4.7/5 (33)
The mean x of a data set is 18, and the sample standard deviation s is 2. Explain what the interval (12, 24) represents.
(Essay)
4.7/5 (43)
If a z-score is 0 or near 0, the measurement is located at or near the mean.
(True/False)
4.7/5 (39)
252 randomly sampled college students were asked, among other things, to estimate their college grade point average (GPA). The responses are shown in the stem-and-leaf plot shown below. Notice that a GPA of 3.65 would be indicated with a stem of 36 and a leaf of 5 in the plot. How many of the students who responded had GPA's that exceeded 3.55? Stem and Leaf Plot of GPA 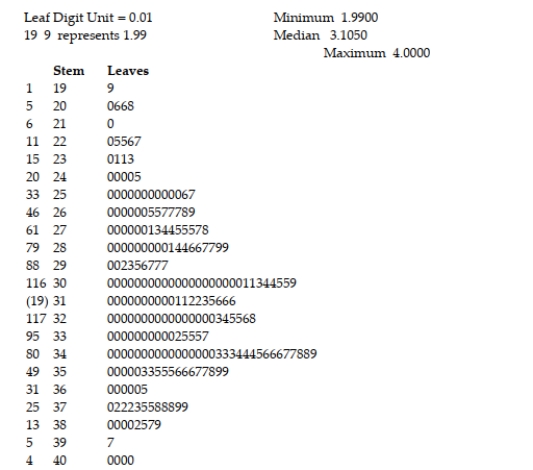 252 cases included
(Multiple Choice)
4.8/5 (45)
The test scores of 30 students are listed below. Which number could be the 30th percentile? 31 41 45 48 52 55 56 56 63 65
67 67 69 70 70 74 75 78 79 79
80 81 83 85 85 87 90 92 95 99
(Multiple Choice)
4.7/5 (32)
The following is a list of 25 measurements: 12 18 14 17 19 16 14 18 15 17 11 13 14 11 16 18 15 13 17 15 14 19 12 16 17 How many of the measurements fall within one standard deviation of the mean?
(Multiple Choice)
4.9/5 (38)
Test scores for a history class had a mean of 79 with a standard deviation of 4.5. Test scores for a physics class had a mean of 69 with a standard deviation of 3.7. One student earned a 86 on the history test and a 85 on the physics test. Calculate the z-score for each test. On which test did the student perform better?
(Essay)
4.8/5 (38)
The amount spent on textbooks for the fall term was recorded for a sample of five hundred university students. The mean expenditure was calculated to be $500 and the standard deviation of the expenditures was calculated to be $100. Suppose a randomly selected student reported that their textbook expenditure was $700. Calculate the z-score for this student's textbook expenditure.
(Multiple Choice)
4.9/5 (29)
Which measures variability about the mean, the range or the standard deviation?
(Short Answer)
4.7/5 (39)
A sample of professional golfers was taken and their driving distance (measured as the average distance as their drive off the tee) and driving accuracy (measured as the percentage of fairways that their drives landed in) were recorded. A scatterplot of the variables is shown below. 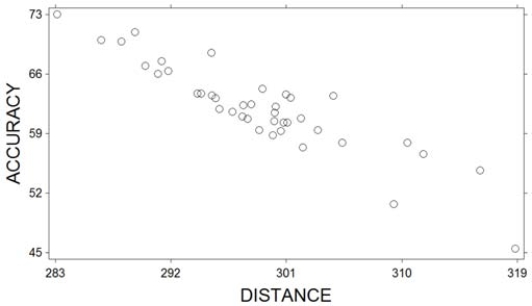 What relationship do these two variables exhibit?
(Multiple Choice)
4.8/5 (32)
The outer fences of a box plot are three standard deviations from the mean.
(True/False)
4.8/5 (38)
A dot plot of the speeds of a sample of 50 cars passing a policeman with a radar gun is shown below. 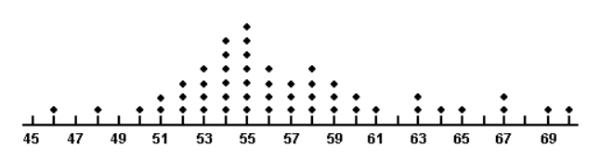 What proportion of the motorists were driving above the posted speed limit of 60 miles per hour?
(Multiple Choice)
4.9/5 (43)
Filters
- Essay(0)
- Multiple Choice(0)
- Short Answer(0)
- True False(0)
- Matching(0)