Exam 2: Methods for Describing Sets of Data
Exam 1: Statistics, Data, and Statistical Thinking73 Questions
Exam 2: Methods for Describing Sets of Data194 Questions
Exam 3: Probability283 Questions
Exam 4: Discrete Random Variables133 Questions
Exam 5: Continuous Random Variables139 Questions
Exam 6: Sampling Distributions47 Questions
Exam 7: Inferences Based on a Single Sample: Estimation With Confidence Intervals124 Questions
Exam 8: Inferences Based on a Single Sample: Tests of Hypothesis140 Questions
Exam 9: Inferences Based on a Two Samples: Confidence Intervals and Tests of Hypotheses94 Questions
Exam 10: Analysis of Variance: Comparing More Than Two Means90 Questions
Exam 11: Simple Linear Regression111 Questions
Exam 12: Multiple Regression and Model Building131 Questions
Exam 13: Categorical Data Analysis60 Questions
Exam 14: Nonparametric Statistics90 Questions
Select questions type
Complete the frequency table for the data shown below. green blue brown orange blue brown orange blue red green blue brown green red brown blue brown blue blue red Color Frequency Green Blue Brown Orange
(Essay)
4.8/5  (37)
(37)
The calculator screens summarize a data set. 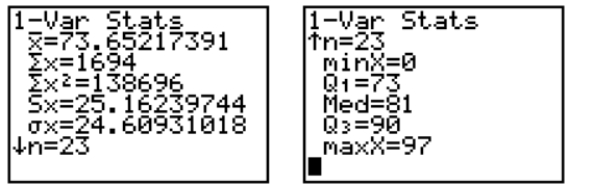 a. Identify the mean and the median. b. Based only on the mean and the median, do you expect that the data set is skewed to the right, symmetric, or skewed to the left? Explain.
(Essay)
4.8/5 (35)
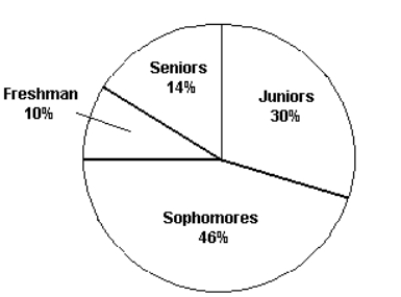 The pie chart shows the classifications of students in a statistics class. What percentage of the class consists of freshman, sophomores, and juniors?
(Multiple Choice)
4.9/5 (31)
In a summary of recent real estate sales, the median home price is given as $325,000. What percentile corresponds to a home price of $325,000?
(Short Answer)
4.8/5 (39)
A recent survey was conducted to compare the cost of solar energy to the cost of gas or electric energy. Results of the survey revealed that the distribution of the amount of the monthly utility bill of a 3-bedroom house using gas or electric energy had a mean of $104 and a standard deviation of $10. If nothing is known about the shape of the distribution, what percentage of homes will have a monthly utility bill of less than $84?
(Multiple Choice)
4.9/5 (38)
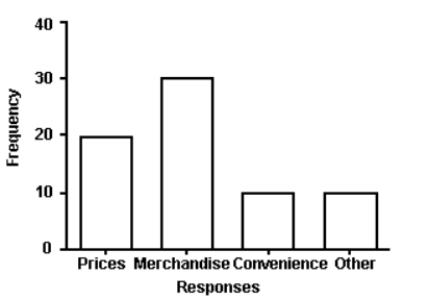 The manager of a store conducted a customer survey to determine why customers shopped at the store. The results are shown in the figure. What proportion of customers responded that merchandise was the reason they shopped at the store? A)
B) 30
C)
D)
The manager of a store conducted a customer survey to determine why customers shopped at the store. The results are shown in the figure. What proportion of customers responded that merchandise was the reason they shopped at the store? A)
B) 30
C)
D)
(Short Answer)
4.9/5 (29)
The calculator screens summarize a data set. 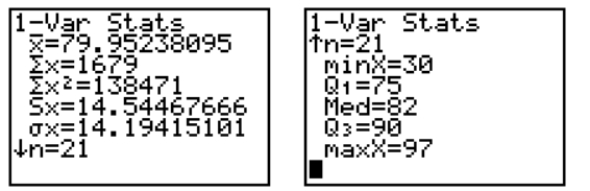 a. Identify the smallest measurement in the data set. b. Identify the largest measurement in the data set. c. Calculate the range of the data set.
(Essay)
4.9/5 (35)
On a given day, the price of a gallon of milk had a mean price of $2.30 with a standard deviation of $0.05. A particular food store sold milk for $2.25/gallon. Interpret the z-score for this gas station.
(Multiple Choice)
4.8/5 (32)
In a symmetric and mound shaped distribution, we expect the values of the mean, median, and mode to differ greatly from one another.
(True/False)
4.8/5 (37)
Explain how stretching the vertical axis of a histogram can be misleading.
(Essay)
4.9/5 (30)
An outlier in a data set may have a simple explanation such as a scale was not working properly or the researcher inverted the digits of a number when recording a measurement.
(True/False)
4.8/5 (44)
Explain how using a scale break on the vertical axis of a histogram can be misleading.
(Essay)
5.0/5 (35)
In symmetric distributions, the mean and the median will be approximately equal.
(True/False)
4.9/5 (27)
A recent survey was conducted to compare the cost of solar energy to the cost of gas or electric energy. Results of the survey revealed that the distribution of the amount of the monthly utility bill of a 3-bedroom house using gas or electric energy had a mean of $135 and a standard deviation of $11. If the distribution can be considered mound-shaped and symmetric, what percentage of homes will have a monthly utility bill of more than $124?
(Multiple Choice)
4.8/5 (31)
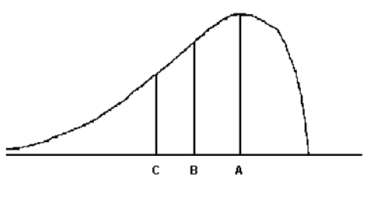 For the distribution drawn here, identify the mean, median, and mode.
A) mode, median, mean
B) median, mode, mean
C) mode, mean, median
D) mean, mode, median
For the distribution drawn here, identify the mean, median, and mode.
A) mode, median, mean
B) median, mode, mean
C) mode, mean, median
D) mean, mode, median
(Short Answer)
4.9/5 (26)
The total points scored by a basketball team for each game during its last season have been summarized in the table below. Identify the modal class of the distribution of scores. Score Frequency 41-60 3 61-80 8 81-100 12 101-120 7
(Essay)
4.9/5 (39)
The amount of television viewed by today's youth is of primary concern to Parents Against Watching Television (PAWT). Three hundred parents of elementary school-aged children were asked to estimate the number of hours per week that their child watches television. The upper quartile for the distribution was given as 15 hours. Interpret this value.
(Essay)
4.9/5 (30)
The amount of time workers spend commuting to their jobs each day in a large metropolitan city has a mean of 70 minutes and a standard deviation of 20 minutes. Assuming the distribution of commuting times is known to be moundshaped and symmetric, what percentage of these commuting times are between 50 and 110 minutes?
(Multiple Choice)
4.9/5 (34)
Many firms use on-the-job training to teach their employees computer programming. Suppose you work in the personnel department of a firm that just finished training a group of its employees to program, and you have been requested to review the performance of one of the trainees on the final test that was given to all trainees. The mean and standard deviation of the test scores are 72 and 3, respectively, and the distribution of scores is mound-shaped and symmetric. Suppose the trainee in question received a score of 64 . Compute the trainee's z-score.
A)
B)
C)
D)
(Short Answer)
4.9/5 (26)
Filters
- Essay(0)
- Multiple Choice(0)
- Short Answer(0)
- True False(0)
- Matching(0)