Exam 2: Methods for Describing Sets of Data
Exam 1: Statistics, Data, and Statistical Thinking73 Questions
Exam 2: Methods for Describing Sets of Data194 Questions
Exam 3: Probability283 Questions
Exam 4: Discrete Random Variables133 Questions
Exam 5: Continuous Random Variables139 Questions
Exam 6: Sampling Distributions47 Questions
Exam 7: Inferences Based on a Single Sample: Estimation With Confidence Intervals124 Questions
Exam 8: Inferences Based on a Single Sample: Tests of Hypothesis140 Questions
Exam 9: Inferences Based on a Two Samples: Confidence Intervals and Tests of Hypotheses94 Questions
Exam 10: Analysis of Variance: Comparing More Than Two Means90 Questions
Exam 11: Simple Linear Regression111 Questions
Exam 12: Multiple Regression and Model Building131 Questions
Exam 13: Categorical Data Analysis60 Questions
Exam 14: Nonparametric Statistics90 Questions
Select questions type
The amount of time workers spend commuting to their jobs each day in a large metropolitan city has a mean of 70 minutes and a standard deviation of 20 minutes. Assuming nothing is known about the shape of the distribution of commuting times, what percentage of these commuting times are between 30 and 110 minutes?
(Multiple Choice)
4.7/5  (26)
(26)
Both Chebyshev's rule and the empirical rule guarantee that no data item will be more than four standard deviations from the mean.
(True/False)
4.9/5 (39)
According to the empirical rule, z-scores of less than -3 or greater than 3 occur very infrequently for data from a mounded and symmetric distribution
(True/False)
4.8/5 (36)
A standardized test has a mean score of 500 points with a standard deviation of 100 points. Five students' scores are shown below. Adam: 575 Beth: 690 Carlos: 750 Doug: 280 Ella: 440 Which of the students have scores within two standard deviations of the mean?
(Multiple Choice)
4.8/5 (32)
The amount spent on textbooks for the fall term was recorded for a sample of five hundred university students. The mean expenditure was calculated to be $500 and the median expenditure was calculated to be $425. Which of the following interpretations of the median is correct?
(Multiple Choice)
4.9/5 (45)
The scores for a statistics test are as follows: 87 76 91 77 94 96 88 85 66 89
79 96 54 98 83 88 82 56 18 69 Create a stem-and-leaf display for the data.
(Essay)
4.9/5 (35)
The amount spent on textbooks for the fall term was recorded for a sample of five university students - $400, $350, $600, $525, and $450. Calculate the value of the sample range for the data.
(Multiple Choice)
4.8/5 (39)
A radio station claims that the amount of advertising each hour has an a mean of 15 minutes and a standard deviation of 1.2 minutes. You listen to the radio station for 1 hour and observe that the amount of advertising time is 12.96 minutes. Based on your observation, what would you infer about the radio station's claim?
(Essay)
4.9/5 (30)
Various state and national automobile associations regularly survey gasoline stations to determine the current retail price of gasoline. Suppose one such national association contacts 200 stations in the United States to determine the price of regular unleaded gasoline at each station. In the context of this problem, define the following descriptive measures: μ, σ, x, s.
(Essay)
4.8/5 (34)
Given the sample variance of a distribution, explain how to find the standard deviation.
(Essay)
4.8/5 (35)
The following data represent the scores of 50 students on a statistics exam. The mean score is 80.02, and the standard deviation is 11.9. 39 51 59 63 66 68 68 69 70 71 71 71 73 74 76 76 76 77 78 79 79 79 79 80 80 82 83 83 83 85 85 86 86 88 88 88 88 89 89 89 90 90 91 91 92 95 96 97 97 98 Use the z-score method to identify potential outliers among the scores.
(Essay)
4.8/5 (32)
If nothing is known about the shape of a distribution, what percentage of the observations fall within 2 standard deviations of the mean?
(Multiple Choice)
4.7/5 (33)
Which of the following statements could be an explanation for the presence of an outlier in the data?
(Multiple Choice)
4.9/5 (39)
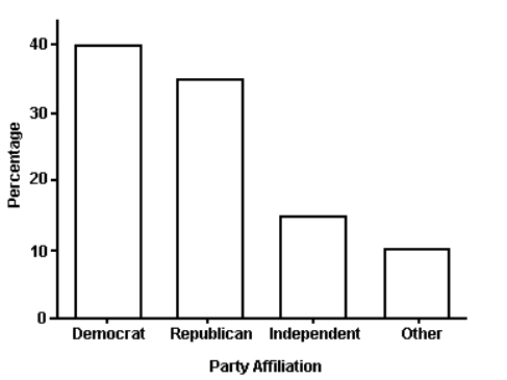 The bar graph shows the political affiliation of 1000 registered U.S. voters. What percentage of the voters belonged to one of the traditional two parties (Democratic or Republican)?
(Multiple Choice)
4.7/5 (41)
260 randomly sampled college students were asked, among other things, to state their year in school (freshman, sophomore, junior, or senior). The responses are shown in the bar graph below. How many of the students who responded would be classified as upperclassmen (e.g., juniors or seniors)? 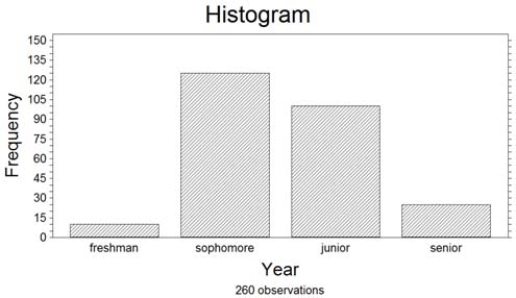
(Multiple Choice)
4.9/5 (36)
The amount spent on textbooks for the fall term was recorded for a sample of five university students - $400, $350, $600, $525, and $450. Calculate the value of the sample standard deviation for the data.
(Multiple Choice)
4.8/5 (34)
The range is an insensitive measure of data variation for large data sets because two data sets can have the same range but be vastly different with respect to data variation.
(True/False)
4.8/5 (30)
At the U.S. Open Tennis Championship a statistician keeps track of every serve that a player hits during the tournament. The lower quartile of a particular player's serve speeds was reported to be 94 mph. Which of the following interpretations of this information is correct?
(Multiple Choice)
4.7/5 (39)
Which of the following statements concerning the box plot and z-score methods for detecting outliers is false?
(Multiple Choice)
4.9/5 (33)
Filters
- Essay(0)
- Multiple Choice(0)
- Short Answer(0)
- True False(0)
- Matching(0)