Exam 2: Methods for Describing Sets of Data
Exam 1: Statistics, Data, and Statistical Thinking73 Questions
Exam 2: Methods for Describing Sets of Data194 Questions
Exam 3: Probability283 Questions
Exam 4: Discrete Random Variables133 Questions
Exam 5: Continuous Random Variables139 Questions
Exam 6: Sampling Distributions47 Questions
Exam 7: Inferences Based on a Single Sample: Estimation With Confidence Intervals124 Questions
Exam 8: Inferences Based on a Single Sample: Tests of Hypothesis140 Questions
Exam 9: Inferences Based on a Two Samples: Confidence Intervals and Tests of Hypotheses94 Questions
Exam 10: Analysis of Variance: Comparing More Than Two Means90 Questions
Exam 11: Simple Linear Regression111 Questions
Exam 12: Multiple Regression and Model Building131 Questions
Exam 13: Categorical Data Analysis60 Questions
Exam 14: Nonparametric Statistics90 Questions
Select questions type
At the U.S. Open Tennis Championship a statistician keeps track of every serve that a player hits during the tournament. The statistician reported that the mean serve speed was 100 miles per hour (mph) and the standard deviation of the serve speeds was 15 mph. If nothing is known about the shape of the distribution, what percentage of the player's serve speeds are less than 70 mph?
(Multiple Choice)
4.8/5  (38)
(38)
A sociologist recently conducted a survey of senior citizens who have net worths too high to qualify for Medicaid but have no private health insurance. The ages of the 25 uninsured senior citizens were as follows: 72 77 70 80 90 78 65 93 69 94 73 96 80 66 85 67 72 85 74 77 64 91 79 68 86 Find the median of the observations.
(Multiple Choice)
4.7/5 (39)
At the U.S. Open Tennis Championship a statistician keeps track of every serve that a player hits during the tournament. The statistician reported that the mean serve speed of a particular player was 95 miles per hour. Suppose that the statistician indicated that the serve speed distribution was skewed to the left. Which of the following values is most likely the value of the median serve speed?
(Multiple Choice)
4.8/5 (29)
The sample variance is always greater than the sample standard deviation.
(True/False)
4.8/5 (35)
Fill in the blank. __________ is a method of interpreting the standard deviation of data that have a mound-shaped, symmetric distribution.
(Multiple Choice)
4.7/5 (29)
A data set contains the observations 2, 6, 4, 7, 3. Find .
(Multiple Choice)
4.8/5 (44)
Chebyshev's rule applies to qualitative data sets, while the empirical rule applies to quantitative data sets.
(True/False)
4.7/5 (38)
The range of scores on a statistics test was 42. The lowest score was 57. What was the highest score?
(Multiple Choice)
4.9/5 (36)
Many firms use on-the-job training to teach their employees computer programming. Suppose you work in the personnel department of a firm that just finished training a group of its employees to program, and you have been requested to review the performance of one of the trainees on the final test that was given to all trainees. The mean and standard deviation of the test scores are 79 and 2, respectively, and the distribution of scores is mound-shaped and symmetric. What percentage of test-takers scored better than a trainee who scored 73?
(Multiple Choice)
4.9/5 (43)
Which of the following is not a measure of central tendency?
(Multiple Choice)
4.8/5 (40)
Fill in the blank. __________ gives us a method of interpreting the standard deviation of any data set, regardless of the shape of the distribution.
(Multiple Choice)
4.9/5 (33)
The slices of a pie chart must be arranged from largest to smallest in a clockwise direction.
(True/False)
4.9/5 (39)
The scatterplot below shows a negative relationship between two variables. 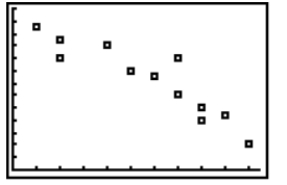
(True/False)
4.8/5 (29)
A sociologist recently conducted a survey of citizens over 60 years of age who have net worths too high to qualify for Medicaid but have no private health insurance. The ages of the 25 uninsured senior citizens were as follows: 68 73 66 76 86 74 61 89 65 90 69 92 76 62 81 63 68 81 70 73 60 87 75 64 82 Find the upper quartile of the data.
(Multiple Choice)
4.7/5 (35)
Box plots are used to detect outliers in qualitative data sets, while z-scores are used to detect outliers in quantitative data sets.
(True/False)
4.8/5 (27)
The amount spent on textbooks for the fall term was recorded for a sample of five hundred university students. It was determined that the 75th percentile was the value $500. Which of the following interpretations of the 75th percentile is correct?
(Multiple Choice)
4.8/5 (36)
The table shows the number of each type of car sold in June. Car Number compact 7,204 sedan 9,089 small SUV 20,418 large SUV 13,691 minivan 15,837 truck 15,350 Total 81,589 a. Construct a relative frequency table for the car sales. b. Construct a Pareto diagram for the car sales using the class percentages as the heights of the bars.
(Essay)
4.9/5 (41)
The mean of a data set is 36.71, and the sample standard deviation s is 3.22. Find the interval representing measurements within one standard deviation of the mean.
(Multiple Choice)
4.8/5 (43)
Filters
- Essay(0)
- Multiple Choice(0)
- Short Answer(0)
- True False(0)
- Matching(0)