Exam 2: Methods for Describing Sets of Data
Exam 1: Statistics, Data, and Statistical Thinking73 Questions
Exam 2: Methods for Describing Sets of Data194 Questions
Exam 3: Probability283 Questions
Exam 4: Discrete Random Variables133 Questions
Exam 5: Continuous Random Variables139 Questions
Exam 6: Sampling Distributions47 Questions
Exam 7: Inferences Based on a Single Sample: Estimation With Confidence Intervals124 Questions
Exam 8: Inferences Based on a Single Sample: Tests of Hypothesis140 Questions
Exam 9: Inferences Based on a Two Samples: Confidence Intervals and Tests of Hypotheses94 Questions
Exam 10: Analysis of Variance: Comparing More Than Two Means90 Questions
Exam 11: Simple Linear Regression111 Questions
Exam 12: Multiple Regression and Model Building131 Questions
Exam 13: Categorical Data Analysis60 Questions
Exam 14: Nonparametric Statistics90 Questions
Select questions type
The mean and the median are useful measures of central tendency for both qualitative and quantitative data.
(True/False)
4.9/5  (36)
(36)
Many firms use on-the-job training to teach their employees computer programming. Suppose you work in the personnel department of a firm that just finished training a group of its employees to program, and you have been requested to review the performance of one of the trainees on the final test that was given to all trainees. The mean of the test scores is 74. Additional information indicated that the median of the test scores was 84. What type of distribution most likely describes the shape of the test scores?
(Multiple Choice)
4.9/5 (38)
The following data represent the scores of 50 students on a statistics exam. The mean score is 80.02, and the standard deviation is 11.9. 39 51 59 63 66 68 68 69 70 71 71 71 73 74 76 76 76 77 78 79 79 79 79 80 80 82 83 83 83 85 85 86 86 88 88 88 88 89 89 89 90 90 91 91 92 95 96 97 97 98 Find the z-scores for the highest and lowest exam scores.
(Short Answer)
5.0/5 (36)
If a sample has mean 0 and standard deviation 1, then for every measurement x in the sample the z-score of x is x itself.
(True/False)
4.8/5 (30)
The process for finding a percentile is similar to the process for finding the median.
(True/False)
4.8/5 (34)
Which of the graphical techniques below can be used to summarize qualitative data?
(Multiple Choice)
4.8/5 (37)
An outlier is defined as any observation that falls within the outer fences of a box plot.
(True/False)
4.9/5 (33)
What characteristic of a Pareto diagram distinguishes it from other bar graphs?
(Essay)
4.7/5 (35)
An outlier may be caused by accidentally including the height of a six-year-old boy in a set of data representing the heights of 12-year-old boys.
(True/False)
4.9/5 (29)
The scores of nine members of a women's golf team in two rounds of tournament play are listed below. Player 1 2 3 4 5 6 7 8 9 Round 1 85 90 87 78 92 85 79 93 86 Round 2 90 87 85 84 86 78 77 91 82 Construct a scattergram for the data.
(Essay)
4.8/5 (31)
Calculate the range of the following data set: 9, 6, 9, 2, 8, 10, 6, 6, 9
(Multiple Choice)
4.9/5 (37)
By law, a box of cereal labeled as containing 18 ounces must contain at least 18 ounces of cereal. The machine filling the boxes produces a distribution of fill weights with a mean equal to the setting on the machine and with a standard deviation equal to 0.03 ounce. To ensure that most of the boxes contain at least 18 ounces, the machine is set so that the mean fill per box is 18.09 ounces. Assuming nothing is known about the shape of the distribution, what can be said about the proportion of cereal boxes that contain less than 18 ounces.
(Multiple Choice)
4.9/5 (30)
Which number on the screen below is the sample standard deviation of the data? 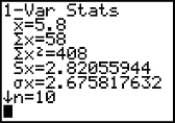
(Multiple Choice)
4.7/5 (33)
The box plot shown below displays the amount of soda that was poured by a filling machine into 12 -ounce soda cans at a local bottling company. Based on the box plot, what shape do you believe the distribution of the data to have?
(Multiple Choice)
4.9/5 (27)
Filters
- Essay(0)
- Multiple Choice(0)
- Short Answer(0)
- True False(0)
- Matching(0)