Exam 2: Methods for Describing Sets of Data
Exam 1: Statistics, Data, and Statistical Thinking73 Questions
Exam 2: Methods for Describing Sets of Data194 Questions
Exam 3: Probability283 Questions
Exam 4: Discrete Random Variables133 Questions
Exam 5: Continuous Random Variables139 Questions
Exam 6: Sampling Distributions47 Questions
Exam 7: Inferences Based on a Single Sample: Estimation With Confidence Intervals124 Questions
Exam 8: Inferences Based on a Single Sample: Tests of Hypothesis140 Questions
Exam 9: Inferences Based on a Two Samples: Confidence Intervals and Tests of Hypotheses94 Questions
Exam 10: Analysis of Variance: Comparing More Than Two Means90 Questions
Exam 11: Simple Linear Regression111 Questions
Exam 12: Multiple Regression and Model Building131 Questions
Exam 13: Categorical Data Analysis60 Questions
Exam 14: Nonparametric Statistics90 Questions
Select questions type
Parking at a university has become a problem. University administrators are interested in determining the average time it takes a student to find a parking spot. An administrator inconspicuously followed 280 students and recorded how long it took each of them to find a parking spot. The times had a distribution that was skewed to the left. Based on this information, discuss the relationship between the mean and the median for the 280 times collected.
(Essay)
4.8/5  (38)
(38)
If 25% of your statistics class is sophomores, then in a pie chart representing classifications of the students in your statistics class the slice assigned to sophomores is 90°.
(True/False)
4.8/5 (28)
Given a data set, which of the following is most likely to be the percentage of data within three standard deviations of the mean?
(Multiple Choice)
4.7/5 (26)
The scores for a statistics test are as follows: 95 76 68 77 73 92 81 85 77 89 79 87 50 60 85 72 85 62 18 74 Compute the mean score.
(Multiple Choice)
4.8/5 (34)
At the U.S. Open Tennis Championship a statistician keeps track of every serve that a player hits during the tournament. The statistician reported that the mean serve speed of a particular player was 98 miles per hour (mph) and the standard deviation of the serve speeds was 9 mph. Assume that the statistician also gave us the information that the distribution of the serve speeds was mound-shaped and symmetric. What proportion of the player's serves was between 107 mph and 116 mph?
(Multiple Choice)
4.8/5 (32)
The amount spent on textbooks for the fall term was recorded for a sample of five university students - $400, $350, $600, $525, and $450. Calculate the value of the sample mean for the data.
(Multiple Choice)
4.7/5 (32)
The data below show the types of medals won by athletes representing the United States in the Winter Olympics. gold gold silver gold bronze silver silver bronze gold silver silver bronze silver gold gold silver silver bronze bronze gold silver gold gold bronze bronze a. Construct a frequency table for the data. b. Construct a relative frequency table for the data. c. Construct a frequency bar graph for the data.
(Essay)
4.9/5 (34)
The data show the total number of medals (gold, silver, and bronze) won by each country winning at least one gold medal in the Winter Olympics. Find the range, sample variance, and sample standard deviation of the numbers of medals won by these countries. 1 2 3 3 4 9 9 11 11 11 14 14 19 22 23 24 25 29
(Essay)
4.8/5 (39)
The calculator screens summarize a data set. 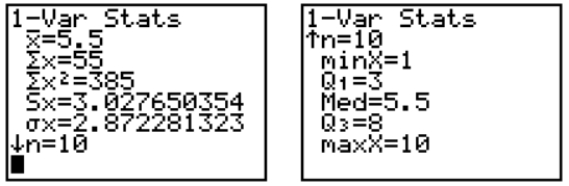 a. Identify the mean and the sample standard deviation. Round to one place after the decimal, where necessary. b. Find the interval that corresponds to measurements within two standard deviations of the mean.
(Essay)
4.7/5 (35)
In a distribution that is skewed to the right, what is the relationship of the mean, median, and mode?
(Multiple Choice)
4.8/5 (36)
The speeds of the fastballs thrown by major league baseball pitchers were measured by radar gun. The mean speed was 87 miles per hour. The standard deviation of the speeds was 3 mph. Which of the following speeds would be classified as an outlier?
(Multiple Choice)
4.9/5 (42)
A shoe retailer keeps track of all types of information about sales of newly released shoe styles. One newly released style was marketed to tall people. Listed below are the shoe sizes of 12 randomly selected customers who purchased the new style. Find the mode of the shoe sizes. 9 11 12 11 8 10 8 11 10 11 9 10
A) 11
B)
C)
D)
(Short Answer)
4.9/5 (41)
The table shows the number of each type of book found at an online auction site during a recent search. Type of Book Number Children's 51,033 Fiction 141,114 Nonfiction 253,074 Educational 67,252 a. Construct a relative frequency table for the book data. b. Construct a pie chart for the book data.
(Essay)
4.9/5 (37)
In an eye color study, 25 out of 50 people in the sample had brown eyes. In this situation, what does the number .50 represent?
(Multiple Choice)
5.0/5 (33)
At the U.S. Open Tennis Championship a statistician keeps track of every serve that a player hits during the tournament. The statistician reported that the mean serve speed of a particular player was 103 miles per hour (mph) and the standard deviation of the serve speeds was 12 mph. Using the z-score approach for detecting outliers, which of the following serve speeds would represent outliers in the distribution of the player's serve speeds? Speeds: 61 mph, 115 mph, and 127 mph
(Multiple Choice)
4.8/5 (27)
A small computing center has found that the number of jobs submitted per day to its computers has a distribution that is approximately mound-shaped and symmetric, with a mean of 88 jobs and a standard deviation of 7. Where do we expect approximately 95% of the distribution to fall?
(Multiple Choice)
4.8/5 (28)
For large data sets, a stem-and-leaf display is a better choice than a histogram.
(True/False)
4.9/5 (35)
Filters
- Essay(0)
- Multiple Choice(0)
- Short Answer(0)
- True False(0)
- Matching(0)