Exam 2: Methods for Describing Sets of Data
Exam 1: Statistics, Data, and Statistical Thinking73 Questions
Exam 2: Methods for Describing Sets of Data194 Questions
Exam 3: Probability283 Questions
Exam 4: Discrete Random Variables133 Questions
Exam 5: Continuous Random Variables139 Questions
Exam 6: Sampling Distributions47 Questions
Exam 7: Inferences Based on a Single Sample: Estimation With Confidence Intervals124 Questions
Exam 8: Inferences Based on a Single Sample: Tests of Hypothesis140 Questions
Exam 9: Inferences Based on a Two Samples: Confidence Intervals and Tests of Hypotheses94 Questions
Exam 10: Analysis of Variance: Comparing More Than Two Means90 Questions
Exam 11: Simple Linear Regression111 Questions
Exam 12: Multiple Regression and Model Building131 Questions
Exam 13: Categorical Data Analysis60 Questions
Exam 14: Nonparametric Statistics90 Questions
Select questions type
The amount spent on textbooks for the fall term was recorded for a sample of five hundred university students. The mean expenditure was calculated to be $500 and the median expenditure was calculated to be $425. Which of the following interpretations of the mean is correct?
(Multiple Choice)
4.8/5  (36)
(36)
Many firms use on-the-job training to teach their employees computer programming. Suppose you work in the personnel department of a firm that just finished training a group of its employees to program, and you have been requested to review the performance of one of the trainees on the final test that was given to all trainees. The mean and standard deviation of the test scores are 83 and 3, respectively, and the distribution of scores is mound-shaped and symmetric. If a firm wanted to give the best 2.5% of the trainees a big promotion, what test score would be used to identify the trainees in question?
(Essay)
4.8/5 (39)
The amount of television viewed by today's youth is of primary concern to Parents Against Watching Television (PAWT). 300 parents of elementary school-aged children were asked to estimate the number of hours per week that their child watches television. The mean and the standard deviation for their responses were 18 and 5, respectively. PAWT constructed a stem-and-leaf display for the data that showed that the distribution of times was a symmetric, mound-shaped distribution. Give an interval where you believe approximately 95% of the television viewing times fell in the distribution.
(Multiple Choice)
4.8/5 (33)
Which of the following is a measure of the variability of a distribution?
(Multiple Choice)
4.8/5 (42)
For a given data set, the lower quartile is 45, the median is 50, and the upper quartile is 57. The minimum value in the data set is 32, and the maximum is 81. a. Find the interquartile range. b. Find the inner fences. c. Find the outer fences. d. Is either of the minimum or maximum values considered an outlier? Explain.
(Essay)
4.8/5 (31)
For a given data set, which is typically greater, the range or the standard deviation?
(Short Answer)
4.9/5 (32)
Fill in the blank. One advantage of the __________ is that the actual data values are retained in the graphical summarization of the data.
(Multiple Choice)
4.8/5 (43)
A histogram can be constructed using either class frequencies or class relative frequencies as the heights of the bars.
(True/False)
4.9/5 (33)
The output below displays the mean and median for the state high school dropout rates in year 1 and in year 5. Year 1 Year 5 N 51 51 MEAN 28.26 26.26 MEDIAN 27.41 25.28 Interpret the year 5 median dropout rate of 25.28.
(Multiple Choice)
4.8/5 (33)
A study was designed to investigate the effects of two variables - (1) a student's level of mathematical anxiety and (2) teaching method - on a student's achievement in a mathematics course. Students who had a low level of mathematical anxiety were taught using the traditional expository method. These students obtained a mean score of 380 and a standard deviation of 50 on a standardized test. Find and interpret the z-score of a student who scored 450 on the standardized test.
(Essay)
4.7/5 (43)
The following data represent the scores of 50 students on a statistics exam. 39 51 59 63 66 68 68 69 70 71 71 71 73 74 76 76 76 77 78 79 79 79 79 80 80 82 83 83 83 85 85 86 86 88 88 88 88 89 89 89 90 90 91 91 92 95 96 97 97 98 a. Find the lower quartile, the upper quartile, and the median of the scores. b. Find the interquartile range of the data and use it to identify potential outliers. c. In a box plot for the data, which scores, if any, would be outside the outer fences? Which scores, if any, would be outside the inner fences but inside the outer fences?
(Essay)
4.8/5 (37)
The calculator screens summarize a data set. 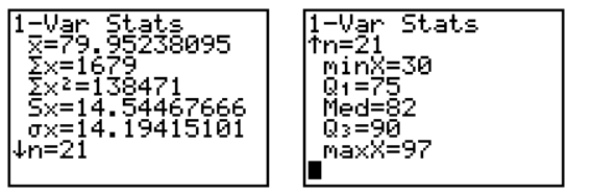 a. Identify the lower and upper quartiles of the data set. b. Find the interquartile range. c. Is there reason to suspect that the data may contain an outlier? Explain.
(Essay)
4.9/5 (35)
The z-score uses the quartiles to identify outliers in a data set.
(True/False)
4.8/5 (45)
A sociologist recently conducted a survey of citizens over 60 years of age who have net worths too high to qualify for Medicaid but have no private health insurance. The ages of the 25 uninsured senior citizens were as follows: 68 73 66 76 86 74 61 89 65 90 69 92 76 62 81 63 68 81 70 73 60 87 75 64 82 Suppose the mean and standard deviation are 74.04 and 9.75, respectively. If we assume that the distribution of ages is mound-shaped and symmetric, what percentage of the respondents will be between 64.29 and 93.54 years old?
(Multiple Choice)
4.9/5 (39)
In practice, the population mean μ is used to estimate the sample mean x.
(True/False)
4.7/5 (35)
Each year advertisers spend billions of dollars purchasing commercial time on network television. In the first 6 months of one year, advertisers spent $1.1 billion. Who were the largest spenders? In a recent article, the top 10 leading spenders and how much each spent (in million of dollars) were listed: Company A \ 71.4 Company F \ 27.1 Company B 60.1 Company G 25.1 Company C 56.5 Company H 23.1 Company D 55 Company I 22.9 Company E 28.6 Company J 20.6 Calculate the sample variance.
(Multiple Choice)
4.8/5 (34)
A study was designed to investigate the effects of two variables - (1) a student's level of mathematical anxiety and (2) teaching method - on a student's achievement in a mathematics course. Students who had a low level of mathematical anxiety were taught using the traditional expository method. These students obtained a mean score of 370 with a standard deviation of 20 on a standardized test. Assuming no information concerning the shape of the distribution is known, what percentage of the students scored between 330 and 410?
(Multiple Choice)
4.9/5 (36)
Explain how it can be misleading to report only the mean of a distribution without any measure of the variability.
(Essay)
4.8/5 (37)
Filters
- Essay(0)
- Multiple Choice(0)
- Short Answer(0)
- True False(0)
- Matching(0)