Exam 2: Methods for Describing Sets of Data
Exam 1: Statistics, Data, and Statistical Thinking73 Questions
Exam 2: Methods for Describing Sets of Data194 Questions
Exam 3: Probability283 Questions
Exam 4: Discrete Random Variables133 Questions
Exam 5: Continuous Random Variables139 Questions
Exam 6: Sampling Distributions47 Questions
Exam 7: Inferences Based on a Single Sample: Estimation With Confidence Intervals124 Questions
Exam 8: Inferences Based on a Single Sample: Tests of Hypothesis140 Questions
Exam 9: Inferences Based on a Two Samples: Confidence Intervals and Tests of Hypotheses94 Questions
Exam 10: Analysis of Variance: Comparing More Than Two Means90 Questions
Exam 11: Simple Linear Regression111 Questions
Exam 12: Multiple Regression and Model Building131 Questions
Exam 13: Categorical Data Analysis60 Questions
Exam 14: Nonparametric Statistics90 Questions
Select questions type
One of the questions posed to a sample of 286 incoming freshmen at a large public university was, "Do you have any tattoos?" Their responses are shown below in the pie chart. Please note that the values shown represent the number of responses in each category. 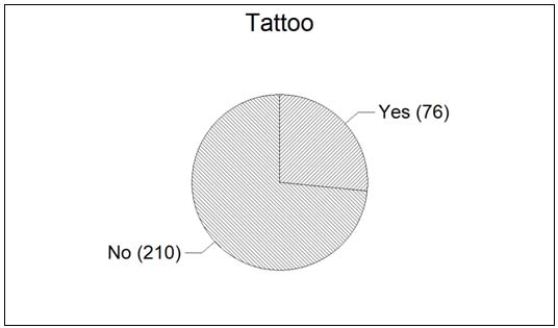 Based on the responses shown in the pie chart, what percentage of the freshmen responded with "Yes?"
(Multiple Choice)
4.9/5  (34)
(34)
The distribution of salaries of professional basketball players is skewed to the right. Which measure of central tendency would be the best measure to determine the location of the center of the distribution?
(Multiple Choice)
4.9/5 (34)
A sample of 100 e-mail users were asked whether their primary e-mail account was a free account, an institutional (school or work) account, or an account that they pay for personally. Identify the classes for the resulting data.
(Essay)
4.9/5 (42)
A Pareto diagram is a pie chart where the slices are arranged from largest to smallest in a counterclockwise direction.
(True/False)
4.9/5 (34)
The output below displays the mean and median for the state high school dropout rates in year 1 and in year 5. Year 1 Year 5 N 51 51 MEAN 28.55 26.19 MEDIAN 27.85 25.82 Use the information to determine the shape of the distributions of the high school dropout rates in year 1 and year 5.
(Essay)
4.7/5 (36)
The box plot shown below was constructed for the amount of soda that was poured by a filling machine into 12-ounce soda cans at a local soda bottling company.  We see that one soda can received 12.15 ounces of soda on the plot above. Based on the box plot presented, how would you classify this observation?
(Multiple Choice)
4.8/5 (31)
The payroll amounts for all teams in an international hockey league are shown below using a graphical technique from chapter 2 of the text. How many of the hockey team payrolls exceeded $20 million (Note: Assume that no payroll was exactly $20 million)? 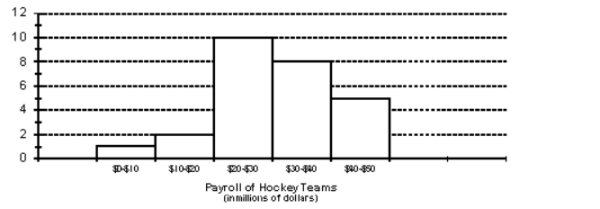
(Multiple Choice)
4.7/5 (27)
Suppose that 50 and 75 are two elements of a population data set and their z-scores are -3 and 2, respectively. Find the mean and standard deviation.
(Short Answer)
4.8/5 (29)
When Scholastic Achievement Test scores (SATs) are sent to test-takers, the percentiles associated with scores are also given. Suppose a test-taker scored at the 67th percentile on the verbal part of the test and at the 38th percentile on the quantitative part. Interpret these results.
(Multiple Choice)
4.9/5 (35)
At the U.S. Open Tennis Championship a statistician keeps track of every serve that a player hits during the tournament. The statistician reported that the mean serve speed was 100 miles per hour (mph) and the standard deviation of the serve speeds was 15 mph. Assume that the statistician also gave us the information that the distribution of serve speeds was mound-shaped and symmetric. What percentage of the player's serves were between 115 mph and 145 mph?
(Multiple Choice)
4.9/5 (30)
A retail store's customer satisfaction rating is at the 88th percentile. What percentage of retail stores has higher customer satisfaction ratings than this store?
(Short Answer)
4.7/5 (40)
The data show the total number of medals (gold, silver, and bronze) won by each country winning at least one gold medal in the Winter Olympics. Find the mean, median, and mode of the numbers of medals won by these countries. 1 2 3 3 4 9 9 11 11 11 14 14 19 22 23 24 25 29
(Essay)
4.8/5 (27)
At the U.S. Open Tennis Championship a statistician keeps track of every serve that a player hits during the tournament. The statistician reported that the mean serve speed of a particular player was 104 miles per hour (mph) and the standard deviation of the serve speeds was 11 mph. If nothing is known about the shape of the distribution, give an interval that will contain the speeds of at least three-fourths of the player's serves.
(Multiple Choice)
4.8/5 (36)
Explain how it can be misleading to draw the bars in a histogram so that the width of each bar is proportional to its height rather than have all bars the same width.
(Essay)
4.9/5 (37)
The box plot shown below was constructed for the amount of soda that was poured by a filling machine into 12-ounce soda cans at a local soda bottling company. 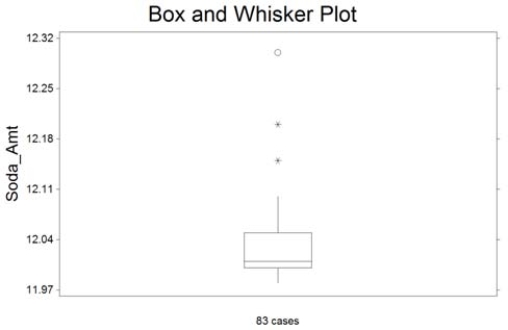 We see that one soda can received 12.30 ounces of soda on the plot above. Based on the box plot presented, how would you classify this observation?
(Multiple Choice)
4.7/5 (49)
At the U.S. Open Tennis Championship a statistician keeps track of every serve that a player hits during the tournament. The statistician reported that the mean serve speed of a particular player was 100 miles per hour (mph) and the standard deviation of the serve speeds was 15 mph. Using the z -score approach for detecting outliers, which of the following serve speeds would represent outliers in the distribution of the player's serve speeds? Speeds: 50 mph, 80 mph, and 105 mph
(Multiple Choice)
4.7/5 (39)
At the U.S. Open Tennis Championship a statistician keeps track of every serve that a player hits during the tournament. The statistician reported that the mean serve speed of a particular player was 104 miles per hour (mph) and the standard deviation of the serve speeds was 11 mph. Assume that the statistician also gave us the information that the distribution of serve speeds was mound-shaped and symmetric. Find the percentage of serves that were hit faster than 82 mph.
(Essay)
4.8/5 (32)
A study was designed to investigate the effects of two variables - (1) a student's level of mathematical anxiety and (2) teaching method - on a student's achievement in a mathematics course. Students who had a low level of mathematical anxiety were taught using the traditional expository method. These students obtained a mean score of 350 with a standard deviation of 40 on a standardized test. Assuming a mound-shaped and symmetric distribution, in what range would approximately 99.7% of the students score?
(Multiple Choice)
4.9/5 (33)
A larger standard deviation means greater variability in the data.
(True/False)
4.8/5 (38)
In skewed distributions, the mean is the best measure of the center of the distribution since it is least affected by extreme observations.
(True/False)
4.8/5 (32)
Filters
- Essay(0)
- Multiple Choice(0)
- Short Answer(0)
- True False(0)
- Matching(0)