Exam 6: Normal Probability Distributions
Exam 1: Introduction to Statistics106 Questions
Exam 2: Summarizing and Graphing Data85 Questions
Exam 3: Statistics for Describing, Exploring, and Comparing Data187 Questions
Exam 4: Probability186 Questions
Exam 5: Discrete Probability Distributions155 Questions
Exam 6: Normal Probability Distributions227 Questions
Exam 7: Estimates and Sample Size141 Questions
Exam 8: Hypothesis Testing139 Questions
Exam 9: Inferences From Two Samples133 Questions
Exam 10: Correlation and Regression104 Questions
Exam 11: Chi-Square and Analysis of Variance65 Questions
Select questions type
The ages (in years) of the four U.S. vice presidents who assumed office after presidential assassinations are 56 (A. Johnson), 51 (C. Arthur), 42 (T. Roosevelt), and 55 (L.B. Johnson).
(i) Assuming that 2 of the ages are randomly selected with replacement, list the 16 different possible samples.
(ii) Find the median of each of the 16 samples, then summarize the sampling distribution of the medians in the format of a table representing the probability distribution.
(iii) Compare the population median to the mean of the sample medians.
(iv) Do the sample medians target the value of the population median? In general, do sample medians make good estimators of population medians? Why or why not?
(Essay)
4.8/5  (35)
(35)
A study of the amount of time it takes a mechanic to rebuild the transmission for a 2005 Chevrolet Cavalier shows that the mean is 8.4 hours and the standard deviation is 1.8 hours. If 40 mechanics are randomly selected, find the probability that their mean rebuild time is less than 8.9 hours.
(Multiple Choice)
4.8/5 (36)
Find the indicated z score. The graph depicts the standard normal distribution with mean 0 and standard deviation 1.
-Shaded area is 0.0901. 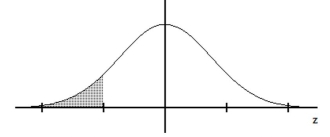
(Multiple Choice)
4.9/5 (38)
Draw a normal distribution and identify the mean of x on the distribution. Discuss the symmetry and the total area under the curve. What is the probability that a value of x will be greater than the mean?
(Essay)
4.8/5 (46)
For the binomial distribution with the given values for n and p, state whether or not it is suitable to use the normal distribution as an approximation.
-
(Multiple Choice)
4.8/5 (40)
The typical computer random-number generator yields numbers in a uniform distribution between 0 and 1 with a mean of 0.500 and a standard deviation of 0.289. (a) Suppose a sample of size 50 is randomly generated. Find the probability that the mean is below 0.300.
(b) Suppose a sample size of 15 is randomly generated. Find the probability that the mean is below 0.300. These two problems appear to be very similar. Only one can be solved by the central limit theorem. Which one and why?
(Essay)
5.0/5 (39)
Scores on a test have a mean of . The scores have a distribution that is approximately normal. Find the standard deviation. Round your answer to the nearest tenth.
(Multiple Choice)
4.8/5 (33)
The given values are discrete. Use the continuity correction and describe the region of the normal distribution that corresponds to the indicated probability.
-The probability of more than 56 correct answers
(Multiple Choice)
4.8/5 (42)
The ages (in years) of the four U.S. vice presidents who assumed office after presidential assassinations are 56 (A. Johnson), 51 (C. Arthur), 42 (T. Roosevelt), and 55 (L.B. Johnson).
(i) Assuming that 2 of the ages are randomly selected with replacement, list the 16 different possible samples.
(ii) Find the standard deviation of each of the 16 samples, then summarize the sampling distribution of the standard deviation in the format of a table representing the probability distribution.
(iii) Compare the population standard deviation to the mean of the sample standard deviations.
(iv) Do the sample standard deviations target the value of the population standard deviation? In general, do sample standard deviations make good estimators of population standard deviations? Why or why not?
(Essay)
4.8/5 (35)
Assume that X has a normal distribution, and find the indicated probability.
-The mean is and the standard deviation is . Find the probability that is greater than 17 .
(Multiple Choice)
4.9/5 (39)
Estimate the indicated probability by using the normal distribution as an approximation to the binomial distribution.
-The probability that a radish seed will germinate is 0.7. Estimate the probability that of 140 randomly selected seeds, exactly 100 will germinate.
(Multiple Choice)
5.0/5 (30)
Which of the following is true about the distribution of IQ scores?
(Multiple Choice)
5.0/5 (25)
The incomes of trainees at a local mill are normally distributed with a mean of $1100 and a standard deviation of $150. What percentage of trainees earn less than $900 a month?
(Multiple Choice)
4.8/5 (37)
Three randomly selected households are surveyed as a pilot project for a larger survey to be conducted later. The numbers of people in the households are 2, 3, and 10. Consider the values of 2, 3, and 10 to be a population. Assume that samples of size n = 2 are randomly selected with replacement from the population of 2, 3, and 10. The nine different samples are as follows: (2, 2), (2, 3), (2, 10), (3, 2), (3, 3), (3, 10), (10, 2), (10, 3), and (10, 10).
(i) Find the standard deviation of each of the nine samples, then summarize the sampling distribution of the standard deviations in the format of a table representing the probability
distribution.
(ii) Compare the population standard deviation to the mean of the sample standard deviations.
(iii) Do the sample standard deviations target the value of the population standard deviation? In general, do standard deviations make good estimators of population standard deviation? Why or why not?
(Essay)
4.8/5 (32)
State the central limit theorem. Describe the sampling distribution for a population that is uniform and for a population that is normal.
(Essay)
4.9/5 (30)
Human body temperatures are normally distributed with a mean of 98.20°F and a standard deviation of 0.62°F. If 19 people are randomly selected, find the probability that their mean body temperature will be less than 98.50°F.
(Multiple Choice)
4.8/5 (41)
Define a density curve and describe the two properties that it must satisfy. Show a density curve for a uniform distribution. Make sure that your graph satisfies both properties.
(Essay)
4.9/5 (35)
Describe the difference between z scores and area scores. Show each score's relationship to the graph of the standard normal distribution and discuss the possible sign values for each score.
(Essay)
4.9/5 (35)
Assume that z scores are normally distributed with a mean of 0 and a standard deviation of 1. If
(Multiple Choice)
4.9/5 (47)
Filters
- Essay(0)
- Multiple Choice(0)
- Short Answer(0)
- True False(0)
- Matching(0)