Exam 6: Normal Probability Distributions
Exam 1: Introduction to Statistics106 Questions
Exam 2: Summarizing and Graphing Data85 Questions
Exam 3: Statistics for Describing, Exploring, and Comparing Data187 Questions
Exam 4: Probability186 Questions
Exam 5: Discrete Probability Distributions155 Questions
Exam 6: Normal Probability Distributions227 Questions
Exam 7: Estimates and Sample Size141 Questions
Exam 8: Hypothesis Testing139 Questions
Exam 9: Inferences From Two Samples133 Questions
Exam 10: Correlation and Regression104 Questions
Exam 11: Chi-Square and Analysis of Variance65 Questions
Select questions type
Sketch a brief diagram of the standard normal distribution table. You only need to show two sets of values. Identify the z scores and the area scores in the table by circling the scores and writing z score and area by each one. Describe how to find the area corresponding to a given z score. Describe how to find the the z score corresponding to a given area value.
(Essay)
4.8/5  (35)
(35)
Three randomly selected households are surveyed as a pilot project for a larger survey to be conducted later. The numbers of people in the households are 3, 8, and 10. Consider the values of 3, 8, and 10 to be a population. Assume that samples of size n 2 are randomly selected with replacement from the population of 3, 8, and 10. The nine different samples are as follows: (3, 3), (3, 8), (3, 10), (8, 3), (8, 8), (8, 10), (10, 3), (10, 8), and (10, 10).
(i) Find the median of each of the nine samples, then summarize the sampling distribution of the medians in the format of a table representing the probability distribution.
(ii) Compare the population median to the mean of the sample medians. (iii) Do the sample medians target the value of the population median? In general, do medians make good estimators of population medians? Why or why not?
(Essay)
4.8/5 (38)
Find the indicated IQ score. The graph depicts IQ scores of adults, and those scores are normally distributed with a mean of 100 and a standard deviation of 15 (as on the Wechsler test). 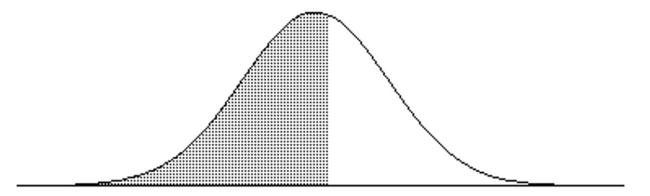 The shaded area under the curve is 0.5675.
(Multiple Choice)
4.8/5 (47)
For women aged , systolic blood pressures (in ) are normally distributed with a mean of and a standard deviation of 13.1. If 36 women are selected at random from a population of 300 women aged 18-24, find the probability that their mean systolic blood pressure will be less than . Assume that the sampling is done without replacement and use a finite population correction factor with .
(Multiple Choice)
4.7/5 (38)
Explain why a continuity correction factor is necessary when approximating the binomial distribution by the normal distribution. Refer to the terms "discrete" and continuous", and draw a diagram to support your answer.
(Essay)
4.9/5 (34)
If z is a standard normal variable, find the probability.
-
(Multiple Choice)
4.9/5 (36)
Estimate the indicated probability by using the normal distribution as an approximation to the binomial distribution.
-A multiple choice test consists of 60 questions. Each question has 4 possible answers of which one is correct. If all answers are random guesses, estimate the probability of getting at least 20% correct.
(Multiple Choice)
4.8/5 (36)
The serum cholesterol levels for men in one age group are normally distributed with a mean of 177.9 and a standard deviation of 40.5. All units are in mg/100 mL. Find the two levels that separate the top 9% and the bottom 9%.
(Multiple Choice)
4.8/5 (40)
Assume that X has a normal distribution, and find the indicated probability.
-The mean is and the standard deviation is . Find the probability that is between and 140.1.
(Multiple Choice)
4.8/5 (45)
Use the normal distribution to approximate the desired probability.
-A coin is tossed 20 times. A person, who claims to have extrasensory perception, is asked to predict the outcome of each flip in advance. She predicts correctly on 16 tosses. What is the probability of being correct 16 or more times by guessing? Does this probability seem to verify her claim?
(Multiple Choice)
4.8/5 (32)
Under what conditions are you allowed to use the normal distribution to approximate the binomial distribution? Under what conditions might you want to use the normal distribution to approximate the binomial as opposed to using the binomial probability formula, a table of binomial probabilities, or a computer?
(Essay)
4.8/5 (33)
Find the area of the shaded region. The graph depicts the standard normal distribution with mean 0 and standard deviation 1.
-
(Multiple Choice)
4.8/5 (38)
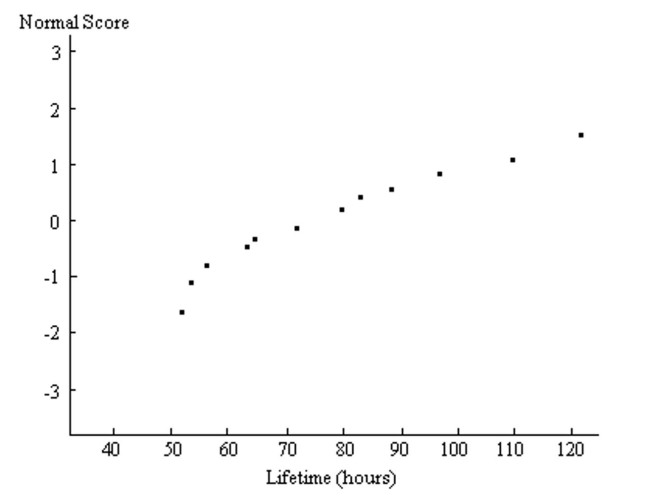
A normal quartile plot is given below for the lifetimes (in hours) of a sample of batteries of a particular brand. Use the plot to assess the normality of the lifetimes of these batteries. Explain your reasoning.
(Essay)
4.8/5 (36)
Scores on a test are normally distributed with a mean of 68.2 and a standard deviation of 10.4. Estimate the probability that among 75 randomly selected students, at least 20 of them score greater than 78.
(Multiple Choice)
4.8/5 (24)
Which of the following is true about the distribution of IQ scores?
(Multiple Choice)
4.9/5 (35)
In a certain population, 11% of people are left-handed. Suppose that you plan to randomly select 100 people and ask each person whether they are left handed. Suppose that in calculating each of the probabilities below, you use the normal distribution as an approximation to the binomial but that you fail to use a continuity correction. In which cases will you obtain an answer that is too large?
A: the probability that among the 100 people, at least 12 are left-handed
B: the probability that among the 100 people, more than 12 are left-handed
C: the probability that among the 100 people, between 10 and 14 inclusive are left-handed
(Multiple Choice)
4.9/5 (32)
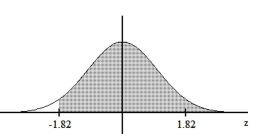
Find the area of the shaded region. The graph depicts the standard normal distribution with mean 0 and standard deviation 1.
-
(Multiple Choice)
4.9/5 (41)
For a standard normal distribution, find the percentage of data that are more than 2 standard deviations below the mean or more than 3 standard deviations above the mean.
(Multiple Choice)
4.8/5 (31)
If z is a standard normal variable, find the probability.
-The probability that z is greater than
(Multiple Choice)
4.7/5 (42)
Three randomly selected households are surveyed as a pilot project for a larger survey to be conducted later. The numbers of people in the households are 3, 6, and 7. Consider the values of 3, 6, and 7 to be a population. Assume that samples of size n = 2 are randomly selected with replacement from the population of 3, 6, and 7. The nine different samples are as follows:
(3, 3), (3, 6), (3, 7), (6, 3), (6, 6), (6, 7), (7, 3), (7, 6), and (7, 7).
(i) Construct a probability distribution table that describes the sampling distribution of the proportion of even numbers when samples of size n = 2 are randomly selected.
(ii) Does the mean of the sample proportions target the value of the population proportion?
(iii) Does the sample proportion make a good estimator of the population proportion?
(Essay)
4.9/5 (35)
Filters
- Essay(0)
- Multiple Choice(0)
- Short Answer(0)
- True False(0)
- Matching(0)