Exam 6: Normal Probability Distributions
Exam 1: Introduction to Statistics106 Questions
Exam 2: Summarizing and Graphing Data85 Questions
Exam 3: Statistics for Describing, Exploring, and Comparing Data187 Questions
Exam 4: Probability186 Questions
Exam 5: Discrete Probability Distributions155 Questions
Exam 6: Normal Probability Distributions227 Questions
Exam 7: Estimates and Sample Size141 Questions
Exam 8: Hypothesis Testing139 Questions
Exam 9: Inferences From Two Samples133 Questions
Exam 10: Correlation and Regression104 Questions
Exam 11: Chi-Square and Analysis of Variance65 Questions
Select questions type
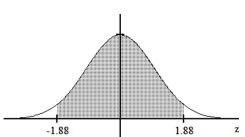
Find the area of the shaded region. The graph depicts the standard normal distribution with mean 0 and standard deviation 1.
-
(Multiple Choice)
4.8/5  (39)
(39)
Three randomly selected households are surveyed as a pilot project for a larger survey to be conducted later. The numbers of people in the households are 1, 4, and 8. Consider the values of 1, 4, and 8 to be a population. Assume that samples of size n = 2 are randomly selected with replacement from the population of 1, 4, and 8. The nine different samples are as follows: (1, 1), (1, 4), (1, 8), (4, 1), (4, 4), (4, 8), (8, 1), (8, 4), and (8, 8).
(i) Find the median of each of the nine samples, then summarize the sampling distribution of the medians in the format of a table representing the probability distribution.
(ii) Compare the population median to the mean of the sample medians.
(iii) Do the sample medians target the value of the population median? In general, do medians make good estimators of population medians? Why or why not?
(Essay)
4.7/5 (43)
If selecting samples of si from a population with a known mean and standard deviation,what requirement, if any, must be satisfied in order to assume that the distribution of the sample means is a normal distribution?
(Multiple Choice)
4.8/5 (42)
A bank's loan officer rates applicants for credit. The ratings are normally distributed with a mean of 200 and a standard deviation of 50. If an applicant is randomly selected, find the probability of a rating that is between 200 and 275.
(Multiple Choice)
4.9/5 (34)
The weekly salaries of teachers in one state are normally distributed with a mean of $490 and a standard deviation of $45. What is the probability that a randomly selected teacher earns more than $525 a week?
(Multiple Choice)
4.8/5 (35)
In a game of roulette, Jorge places 170 bets of $1 each on the number 3. A win pays off with odds 35:1 and on any one spin there is a 1/38 probability that 3 will be the winning number. Among the 170 bets, what is the minimum number of wins needed for Jorge to make a profit? Estimate the
Probability that Jorge will make a profit.
(Multiple Choice)
4.8/5 (34)
A math teacher gives two different tests to measure students' aptitude for math. Scores on the first test are normally distributed with a mean of 23 and a standard deviation of 5.3. Scores on the second test are normally distributed with a mean of 71 and a standard deviation of 11.9. Assume that the two tests use different scales to measure the same aptitude. If a student scores 29 on the first test, what would be his equivalent score on the second test? (That is, find the score that would put him in the same percentile.)
(Multiple Choice)
4.8/5 (39)
A final exam in Math 160 has a mean of 73 with standard deviation 7.8. If 24 students are randomly selected, find the probability that the mean of their test scores is greater than 78.
(Multiple Choice)
4.9/5 (38)
SAT verbal scores are normally distributed with a mean of 430 and a standard deviation of 120 (based on data from the College Board ATP). (a) If a single student is randomly selected, find the probability that the sample mean is above 500. (b) If a sample of 35 students are selected randomly, find the probability that the sample mean is above 500.
These two problems appear to be very similar. Which problem requires the application of the central limit theorem, and in what way does the solution process differ between the two problems?
(Essay)
4.7/5 (30)
Find the indicated z score. The graph depicts the standard normal distribution with mean 0 and standard deviation 1.
-Shaded area is 0.4013. 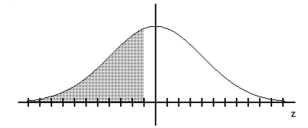
(Multiple Choice)
4.9/5 (48)
Three randomly selected households are surveyed as a pilot project for a larger survey to be conducted later. The numbers of people in the households are 1, 3, and 9. Consider the values of 1, 3, and 9 to be a population. Assume that samples of size n = 2 are randomly selected with replacement from the population of 1, 3, and 9. The nine different samples are as follows: (1, 1), (1, 3), (1, 9), (3, 1), (3, 3), (3, 9), (9, 1), (9, 3), and (9, 9).
(i) Find the variance of each of the nine samples, then summarize the sampling distribution of the variances in the format of a table representing the probability distribution.
(ii) Compare the population variance to the mean of the sample variances.
(iii) Do the sample variances target the value of the population variance? In general, do variances make good estimators of population variances? Why or why not?
(Essay)
4.7/5 (33)
Use the normal distribution to approximate the desired probability.
-Find the probability that in 200 tosses of a fair die, we will obtain at least 40 fives.
(Multiple Choice)
4.8/5 (44)
Assume that X has a normal distribution, and find the indicated probability.
-The mean is and the standard deviation is .
Find the probability that is less than .
(Multiple Choice)
4.8/5 (36)
For the binomial distribution with the given values for n and p, state whether or not it is suitable to use the normal distribution as an approximation.
-
(Multiple Choice)
4.8/5 (38)
Assume that the weight loss for the first month of a diet program varies between 6 pounds and 12 pounds, and is spread evenly over the range of possibilities, so that there is a uniform distribution. Find the probability of the given range of pounds lost.
-Less than 11 pounds
(Multiple Choice)
4.9/5 (34)
Estimate the indicated probability by using the normal distribution as an approximation to the binomial distribution.
-A certain question on a test is answered correctly by 22% of the respondents. Estimate the probability that among the next 150 responses there will be at most 40 correct answers.
(Multiple Choice)
4.8/5 (43)
If z is a standard normal variable, find the probability.
-The probability that z lies between
(Multiple Choice)
4.9/5 (41)
Round to the nearest tenth unless indicated otherwise
-The amount of rainfall in January in a certain city is normally distributed with a mean of 4.9 inches and a standard deviation of 0.3 inches. Find the value of the quartile .
(Multiple Choice)
4.8/5 (39)
A final exam in Math 160 has a mean of 73 with standard deviation 7.8. If 24 students are randomly selected, find the probability that the mean of their test scores is less than 70.
(Multiple Choice)
4.9/5 (42)
The Precision Scientific Instrument Company manufactures thermometers that are supposed to give readings of 0°C at the freezing point of water. Tests on a large sample of these thermometers reveal that at the freezing point of water, some give readings below 0°C (denoted by negative numbers) and some give readings above 0°C (denoted by positive numbers). Assume that the mean reading is 0°C and the standard deviation of the readings is 1.00°C. Also assume that the frequency distribution of errors closely resembles the normal distribution. A thermometer is randomly selected and tested. Find the temperature reading corresponding to the given information.
-Find P40, the 40th percentile.
(Multiple Choice)
4.9/5 (39)
Filters
- Essay(0)
- Multiple Choice(0)
- Short Answer(0)
- True False(0)
- Matching(0)