Exam 6: Normal Probability Distributions
Exam 1: Introduction to Statistics106 Questions
Exam 2: Summarizing and Graphing Data85 Questions
Exam 3: Statistics for Describing, Exploring, and Comparing Data187 Questions
Exam 4: Probability186 Questions
Exam 5: Discrete Probability Distributions155 Questions
Exam 6: Normal Probability Distributions227 Questions
Exam 7: Estimates and Sample Size141 Questions
Exam 8: Hypothesis Testing139 Questions
Exam 9: Inferences From Two Samples133 Questions
Exam 10: Correlation and Regression104 Questions
Exam 11: Chi-Square and Analysis of Variance65 Questions
Select questions type
Estimate the indicated probability by using the normal distribution as an approximation to the binomial distribution.
-Two percent of hair dryers produced in a certain plant are defective. Estimate the probability that of 10,000 randomly selected hair dryers, at least 219 are defective.
(Multiple Choice)
4.9/5  (34)
(34)
Estimate the indicated probability by using the normal distribution as an approximation to the binomial distribution.
-
(Multiple Choice)
4.8/5 (37)
Find the area of the shaded region. The graph depicts the standard normal distribution with mean 0 and standard deviation 1.
-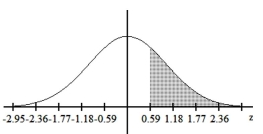
(Multiple Choice)
4.8/5 (37)
Suppose that replacement times for washing machines are normally distributed with a mean of 9.3 years and a standard deviation of 1.1 years. Find the probability that 70 randomly selected washing machines will have a mean replacement time less than 9.1 years.
(Multiple Choice)
4.8/5 (43)
The Precision Scientific Instrument Company manufactures thermometers that are supposed to give readings of 0°C at the freezing point of water. Tests on a large sample of these thermometers reveal that at the freezing point of water, some give readings below 0°C (denoted by negative numbers) and some give readings above 0°C (denoted by positive numbers). Assume that the mean reading is 0°C and the standard deviation of the readings is 1.00°C. Also assume that the frequency distribution of errors closely resembles the normal distribution. A thermometer is randomly selected and tested. Find the temperature reading corresponding to the given information.
-Find , the third quartile.
(Multiple Choice)
4.9/5 (37)
The number of books sold over the course of the four-day book fair were 134, 178, 268, and 58. Assume that samples of size 2 are randomly selected with replacement from this population of four values. List the different possible samples, and find the mean of each of them.
(Essay)
4.8/5 (38)
Assume that women have heights that are normally distributed with a mean of 63.6 inches and a standard deviation of 2.5 inches. Find the value of the quartile .
(Multiple Choice)
4.8/5 (32)
A poll of 1900 randomly selected students in grades 6 through 8 was conducted and found that 37% enjoy playing sports. Would confidence in the results increase if the sample size were 3500 instead of 1900? Why or why not?
(Essay)
4.9/5 (38)
Personal phone calls received in the last three days by a new employee were 2, 6, and 3. Assume that samples of size 2 are randomly selected with replacement from this population of three values. Identify the probability of each sample, and describe the sampling distribution of the sample means.
(Essay)
4.7/5 (40)
The Precision Scientific Instrument Company manufactures thermometers that are supposed to give readings of 0°C at the freezing point of water. Tests on a large sample of these thermometers reveal that at the freezing point of water, some give readings below 0°C (denoted by negative numbers) and some give readings above 0°C (denoted by positive numbers). Assume that the mean reading is 0°C and the standard deviation of the readings is 1.00°C. Also assume that the frequency distribution of errors closely resembles the normal distribution. A thermometer is randomly selected and tested. Find the temperature reading corresponding to the given information.
-If 7% of the thermometers are rejected because they have readings that are too high, but all other thermometers are acceptable, find the temperature that separates the rejected thermometers from
The others.
(Multiple Choice)
4.8/5 (26)
Assume that X has a normal distribution, and find the indicated probability.
-The mean is and the standard deviation is . Find the probability that is greater than .
(Multiple Choice)
4.8/5 (33)
The given values are discrete. Use the continuity correction and describe the region of the normal distribution that corresponds to the indicated probability.
-The probability of fewer than 47 democrats
(Multiple Choice)
4.8/5 (47)
For a standard normal distribution, find the percentage of data that are between 3 standard deviations below the mean and 1 standard deviation above the mean.
(Multiple Choice)
4.9/5 (34)
Find the indicated z score. The graph depicts the standard normal distribution with mean 0 and standard deviation 1.
-Shaded area is 0.9599. 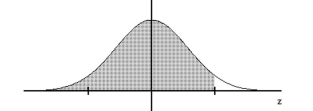
(Multiple Choice)
4.9/5 (41)
If a continuous uniform distribution has parameters of and , then the minimum is and the maximum is . For this distribution, find . Round your answer to three decimal places.
(Multiple Choice)
4.9/5 (43)
The ages (in years) of the four U.S. vice presidents who assumed office after presidential assassinations are 56 (A. Johnson), 51 (C. Arthur), 42 (T. Roosevelt), and 55 (L.B. Johnson).
(i) Assuming that 2 of the ages are randomly selected with replacement, list the 16 different possible samples.
(ii) Find the variance of each of the 16 samples, then summarize the sampling distribution of the variances in the format of a table representing the probability distribution.
(iii) Compare the population variance to the mean of the sample variances.
(iv) Do the sample variances target the value of the population variance? In general, do sample variances make good estimators of population variances? Why or why not?
(Essay)
4.8/5 (38)
A normal quartile plot is given below for the weekly incomes (in dollars) of a sample of engineers in one town. Use the plot to assess the normality of the incomes of engineers in this town. Explain your reasoning. 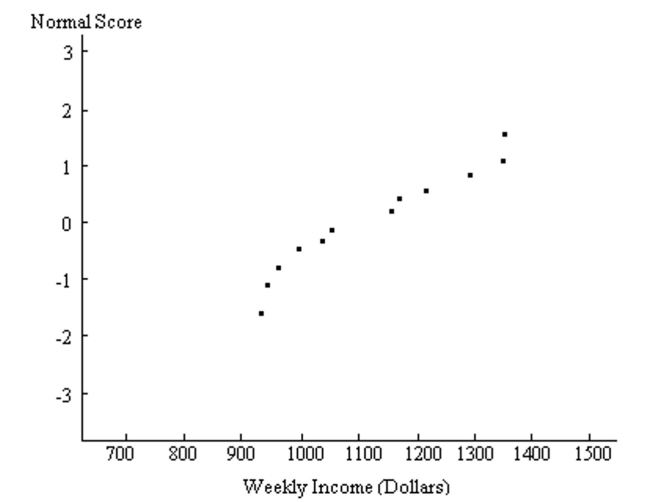
(Essay)
4.7/5 (35)
Estimate the indicated probability by using the normal distribution as an approximation to the binomial distribution.
-With
(Multiple Choice)
4.8/5 (37)
The diameters of bolts produced by a certain machine are normally distributed with a mean of 0.30 inches and a standard deviation of 0.01 inches. What percentage of bolts will have a diameter greater than 0.32 inches?
(Multiple Choice)
4.9/5 (43)
Under what conditions can we apply the results of the central limit theorem?
(Essay)
4.9/5 (29)
Filters
- Essay(0)
- Multiple Choice(0)
- Short Answer(0)
- True False(0)
- Matching(0)