Exam 6: Normal Probability Distributions
Exam 1: Introduction to Statistics106 Questions
Exam 2: Summarizing and Graphing Data85 Questions
Exam 3: Statistics for Describing, Exploring, and Comparing Data187 Questions
Exam 4: Probability186 Questions
Exam 5: Discrete Probability Distributions155 Questions
Exam 6: Normal Probability Distributions227 Questions
Exam 7: Estimates and Sample Size141 Questions
Exam 8: Hypothesis Testing139 Questions
Exam 9: Inferences From Two Samples133 Questions
Exam 10: Correlation and Regression104 Questions
Exam 11: Chi-Square and Analysis of Variance65 Questions
Select questions type
Estimate the indicated probability by using the normal distribution as an approximation to the binomial distribution.
-In one county, the conviction rate for speeding is 85%. Estimate the probability that of the next 100 speeding summonses issued, there will be at least 90 convictions.
(Multiple Choice)
4.8/5  (44)
(44)
After constructing a new manufacturing machine, 5 prototype integrated circuit chips are produced and it is found that 1 is defective (D) and 4 are acceptable (A). Assume that two of the chips are randomly selected with replacement from this population.
(i) After identifying the 25 different possible samples, find the proportion of circuits that are acceptable in each of them, then use a table to describe the sampling distribution of the proportions of circuits that are acceptable.
(ii) Find the mean of the sampling distribution.
(iii) Is the mean of the sampling distribution equal to the population proportion of circuits that are acceptable?
(iv) Does the mean of the sampling distribution of proportions always
equal the population proportion?
(Essay)
4.8/5 (37)
The Precision Scientific Instrument Company manufactures thermometers that are supposed to give readings of 0°C at the freezing point of water. Tests on a large sample of these thermometers reveal that at the freezing point of water, some give readings below 0°C (denoted by negative numbers) and some give readings above 0°C (denoted by positive numbers). Assume that the mean reading is 0°C and the standard deviation of the readings is 1.00°C. Also assume that the frequency distribution of errors closely resembles the normal distribution. A thermometer is randomly selected and tested. Find the temperature reading corresponding to the given information.
-If 9% of the thermometers are rejected because they have readings that are too high, but all other thermometers are acceptable, find the temperature that separates the rejected thermometers from the others.
(Multiple Choice)
4.9/5 (39)
Find the area of the shaded region. The graph depicts IQ scores of adults, and those scores are normally distributed with a mean of 100 and a standard deviation of 15 (as on the Wechsler test). 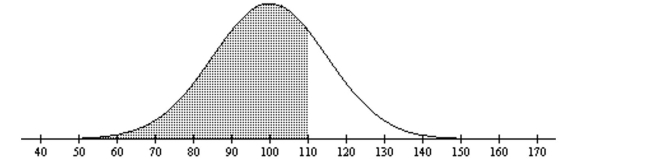
(Multiple Choice)
4.8/5 (36)
A normal quartile plot is given below for a sample of scores on an aptitude test. Use the plot to assess the normality of scores on this test. Explain your reasoning. 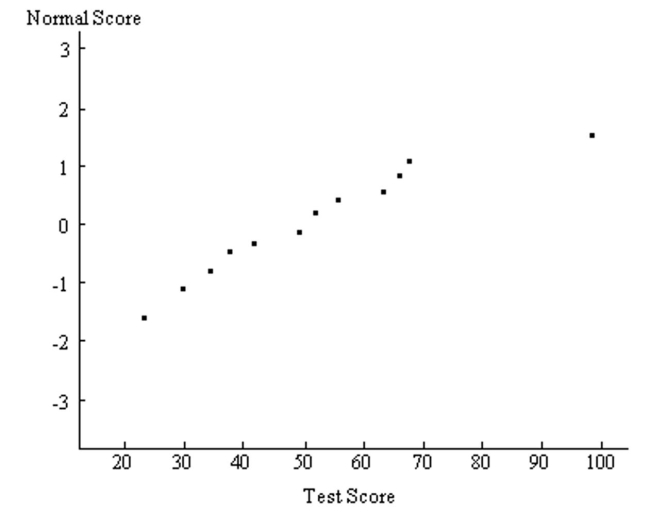
(Essay)
4.8/5 (39)
A study of the amount of time it takes a mechanic to rebuild the transmission for a 2005 Chevrolet Cavalier shows that the mean is 8.4 hours and the standard deviation is 1.8 hours. If 40 mechanics are randomly selected, find the probability that their mean rebuild time is less than 7.6 hours.
(Multiple Choice)
4.9/5 (45)
In a continuous uniform distribution,
Find the mean and standard deviation for a uniform distribution having a minimum of and a maximum of 14.
(Multiple Choice)
4.8/5 (37)
Using the following uniform density curve, answer the question.
-What is the probability that the random variable has a value less than 6.1?
(Multiple Choice)
4.7/5 (41)
A recent survey based on a random sample of n = 480 voters, predicted that the independent candidate for the mayoral election will get 23% of the vote, but he actually gets 28%. Can it be concluded that the survey was done incorrectly?
(Essay)
4.9/5 (29)
Replacement times for T.V. sets are normally distributed with a mean of 8.2 years and a standard deviation of 1.1 years (based on data from "Getting Things Fixed," Consumers Reports).
(a) Find the probability that a randomly selected T.V. will have a replacement time between 6.5 and 9.5 years.
(b) Find the probability that a randomly selected T.V. willhave a replacement time between 9.5 and 10.5 years. Draw the diagram for each and discuss the part of the solution that would be different in finding the requested probabilities.
(Essay)
4.7/5 (33)
The Precision Scientific Instrument Company manufactures thermometers that are supposed to give readings of 0°C at the freezing point of water. Tests on a large sample of these thermometers reveal that at the freezing point of water, some give readings below 0°C (denoted by negative numbers) and some give readings above 0°C (denoted by positive numbers). Assume that the mean reading is 0°C and the standard deviation of the readings is 1.00°C. Also assume that the frequency distribution of errors closely resembles the normal distribution. A thermometer is randomly selected and tested. Find the temperature reading corresponding to the given information.
-If 6.3% of the thermometers are rejected because they have readings that are too high and another 6.3% are rejected because they have readings that are too low, find the two readings that are cutoff values separating the rejected thermometers from the others.
(Multiple Choice)
4.8/5 (36)
If z is a standard normal variable, find the probability.
-
(Multiple Choice)
4.9/5 (35)
Use the normal distribution to approximate the desired probability.
-Find the probability that in 200 tosses of a fair die, we will obtain at least 30 fives.
(Multiple Choice)
4.8/5 (43)
Describe the process for finding probabilities using z scores and the standard normal distribution. Give an example to support your description.
(Essay)
4.9/5 (37)
The scores on a certain test are normally distributed with a mean score of 53 and a standard deviation of 5. What is the probability that a sample of 90 students will have a mean score of at
Least 53.527?
(Multiple Choice)
4.8/5 (49)
Examine the given data set and determine whether the requirement of a normal distribution is satisfied. Assume that the requirement for a normal distribution is loose in the sense that the population distribution need not be exactly normal, but it must have a distribution which is basically symmetric with only one mode. Explain why you do or do not think that the requirement is satisfied.
-The ages of 30 students selected randomly from one college are as follows: 21 23 20 24 20 19 20 19 22 32 20 24 26 21 37 23 18 34 25 30 22 24 23 19 28 20 29 21 35 25 20 21 28 22 32
(Essay)
4.7/5 (35)
Suppose you are asked to find the 20th percentile and the 80th percentile for a set of scores.
These two problems are solved almost exactly the same. Draw the diagram for each and discuss the part of the solution that would be different in finding the requested probabilities.
(Essay)
4.7/5 (42)
Assume that X has a normal distribution, and find the indicated probability.
-The mean is and the standard deviation is .
Find the probability that is between and .
(Multiple Choice)
5.0/5 (35)
Use the normal distribution to approximate the desired probability.
-A coin is tossed 20 times. A person, who claims to have extrasensory perception, is asked to predict the outcome of each flip in advance. She predicts correctly on 14 tosses. What is the probability of being correct 14 or more times by guessing? Does this probability seem to verify her claim?
(Multiple Choice)
4.9/5 (34)
Three randomly selected households are surveyed as a pilot project for a larger survey to be conducted later. The numbers of people in the households are 5, 6, and 10. Consider the values of 5, 6, and 10 to be a population. Assume that samples of size n = 2 are randomly selected with replacement from the population of 5, 6, and 10. The nine different samples are as follows:
(5, 5), (5, 6), (5, 10), (6, 5), (6, 6), (6, 10), (10, 5), (10, 6), and (10, 10).
(i) Find the variance of each of the nine samples, then summarize the sampling distribution of the variances in the format of a table representing the probability distribution.
(ii) Compare the population variance to the mean of the sample variances.
(iii) Do the sample variances target the value of the population variance? In general, do variances make good estimators of population variances? Why or why not?
(Essay)
4.7/5 (43)
Filters
- Essay(0)
- Multiple Choice(0)
- Short Answer(0)
- True False(0)
- Matching(0)