Exam 6: Normal Probability Distributions
Exam 1: Introduction to Statistics106 Questions
Exam 2: Summarizing and Graphing Data85 Questions
Exam 3: Statistics for Describing, Exploring, and Comparing Data187 Questions
Exam 4: Probability186 Questions
Exam 5: Discrete Probability Distributions155 Questions
Exam 6: Normal Probability Distributions227 Questions
Exam 7: Estimates and Sample Size141 Questions
Exam 8: Hypothesis Testing139 Questions
Exam 9: Inferences From Two Samples133 Questions
Exam 10: Correlation and Regression104 Questions
Exam 11: Chi-Square and Analysis of Variance65 Questions
Select questions type
Use the normal distribution to approximate the desired probability.
-Find the probability that in 200 tosses of a fair die, we will obtain at exactly 30 fives.
(Multiple Choice)
4.8/5  (44)
(44)
In one region, the September energy consumption levels for single-family homes are found to be normally distributed with a mean of 1050 kWh and a standard deviation of 218 kWh. If 50 different homes are randomly selected, find the probability that their mean energy consumption level for September is greater than 1075 kWh.
(Multiple Choice)
4.9/5 (33)
The given values are discrete. Use the continuity correction and describe the region of the normal distribution that corresponds to the indicated probability.
-The probability of no more than 21 defective CD's
(Multiple Choice)
4.8/5 (46)
Examine the given data set and determine whether the requirement of a normal distribution is satisfied. Assume that the requirement for a normal distribution is loose in the sense that the population distribution need not be exactly normal, but it must have a distribution which is basically symmetric with only one mode. Explain why you do or do not think that the requirement is satisfied.
-The numbers obtained on 50 rolls of a die. 1 5 5 3 6 4 5 6 3 4 2 5 3 5 4 2 1 4 3 1 6 1 2 6 1 2 5 3 3 4 4 1 3 1 6 2 2 5 5 3 3 5 1 6 2 1 1 4 6 5
(Essay)
4.7/5 (42)
A bank's loan officer rates applicants for credit. The ratings are normally distributed with a mean of 200 and a standard deviation of 50. If 40 different applicants are randomly selected, find the probability that their mean is above 215.
(Multiple Choice)
4.9/5 (39)
Define a standard normal distribution by identifying its shape and the numeric values for its mean and standard deviation. Mark the mean and the standard deviations on the curve. What do z scores measure? Relate the concept of z scores to the Empirical Rule.
(Essay)
4.9/5 (28)
In one region, the September energy consumption levels for single-family homes are found to be normally distributed with a mean of 1050 kWh and a standard deviation of 218 kWh. For a randomly selected home, find the probability that the September energy consumption level is between 1100 kWh and 1225 kWh.
(Multiple Choice)
4.7/5 (39)
Consider the uniform distribution shown below. Find the probability that x is greater than 6. Discuss the relationship between area under a density curve and probability.
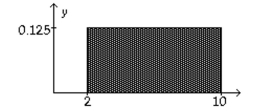
(Essay)
4.9/5 (37)
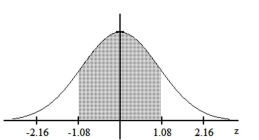
If z is a standard normal variable, find the probability.
-The probability that z lies between
(Multiple Choice)
4.8/5 (40)
Using the following uniform density curve, answer the question. 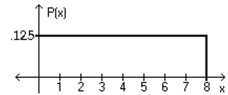 -What is the probability that the random variable has a value greater than 5?
(Multiple Choice)
4.9/5 (38)
In a certain population, 10% of people are left handed. Suppose that in calculating each of the probabilities below, you use the normal distribution as an approximation to the binomial but that you fail to use a continuity correction. In which case will the resulting error be the greatest? In which case will the error be the least? Explain your thinking.
A: the probability that among 50 randomly selected people, at least 5 are left handed
B: the probability that among 100 randomly selected people, more than 10 are left handed
C: the probability that among 200 randomly selected people, at most 20 are left handed
(Essay)
4.8/5 (37)
The diameters of pencils produced by a certain machine are normally distributed with a mean of 0.30 inches and a standard deviation of 0.01 inches. What is the probability that the diameter of a randomly selected pencil will be less than 0.285 inches?
(Multiple Choice)
4.7/5 (37)
Examine the given data set and determine whether the requirement of a normal distribution is satisfied. Assume that the requirement for a normal distribution is loose in the sense that the population distribution need not be exactly normal, but it must have a distribution which is basically symmetric with only one mode. Explain why you do or do not think that the requirement is satisfied.
-The heart rates (in beats per minute) of 30 randomly selected students are given below. 78 64 69 75 80 63 70 72 72 68 77 71 74 84 70 62 67 71 69 58 74 70 80 63 88 60 68 69 70 71
(Essay)
4.8/5 (27)
Find the area of the shaded region. The graph depicts the standard normal distribution with mean 0 and standard
deviation 1.
-
(Multiple Choice)
4.8/5 (28)
The number of books sold over the course of the four-day book fair were 108, 111, 259, and 58. Assume that samples of size 2 are randomly selected with replacement from this population of four values. Identify the probability of each sample, and describe the sampling distribution of the sample means.
(Essay)
4.8/5 (29)
Use the normal distribution to approximate the desired probability.
-Find the probability that in 200 tosses of a fair die, we will obtain at most 30 fives.
(Multiple Choice)
4.8/5 (33)
A final exam in Math 160 has a mean of 73 with standard deviation 7.8. If 24 students are randomly selected, find the probability that the mean of their test scores is greater than 71.
(Multiple Choice)
4.8/5 (30)
Using the following uniform density curve, answer the question. 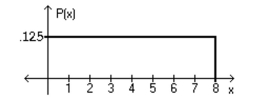 -What is the probability that the random variable has a value greater than 3.3?
(Multiple Choice)
4.8/5 (36)
When sampling without replacement from a finite population of size N, the following formula is used to find the standard deviation of the population of sample means: However, when the sample size n, is smaller than 5% of the population size, N, the finite population correction factor, , can be omitted. Explain in your own words why this is reasonable. For nd the values of the finite population correction factor when the sample size is 10%, 5%, 3%, 1% of the population, respectively. What do you notice?
(Essay)
4.8/5 (33)
According to data from the American Medical Association, 10% of us are left-handed.
Suppose groups of 500 people are randomly selected. Find the probability that at least 80 are left-handed. Describe the characteristics of this problem which help you to recognize that the problem is about a binomial distribution which you are to solve by estimating with the normal distribution. (Assume that you would not use a computer, a table, or the binomial probability formula.)
(Essay)
4.7/5 (37)
Filters
- Essay(0)
- Multiple Choice(0)
- Short Answer(0)
- True False(0)
- Matching(0)