Exam 6: Normal Probability Distributions
Exam 1: Introduction to Statistics106 Questions
Exam 2: Summarizing and Graphing Data85 Questions
Exam 3: Statistics for Describing, Exploring, and Comparing Data187 Questions
Exam 4: Probability186 Questions
Exam 5: Discrete Probability Distributions155 Questions
Exam 6: Normal Probability Distributions227 Questions
Exam 7: Estimates and Sample Size141 Questions
Exam 8: Hypothesis Testing139 Questions
Exam 9: Inferences From Two Samples133 Questions
Exam 10: Correlation and Regression104 Questions
Exam 11: Chi-Square and Analysis of Variance65 Questions
Select questions type
Construct a normal quartile plot of the given data. Use your plot to determine whether the data come from a normally distributed population.
-The weekly incomes (in dollars) of a sample of 12 nurses working at a Los Angeles hospital
are given below.
500 750 630 480 550 650 720 780 820 960 1200 770
(Essay)
4.7/5  (32)
(32)
In one region, the September energy consumption levels for single-family homes are found to be normally distributed with a mean of 1050 kWh and a standard deviation of 21 , which is the consumption level separating the bottom 45% from the top 55%.
(Multiple Choice)
4.8/5 (36)
Assume that adults have IQ scores that are normally distributed with a mean of 100 and a standard deviation of 15 (as on the Wechsler test) core separating the bottom 10% from the top 90%.
(Multiple Choice)
4.8/5 (41)
For the binomial distribution with the given values for n and p, state whether or not it is suitable to use the normal
distribution as an approximation.
-
(Multiple Choice)
4.9/5 (41)
Three randomly selected households are surveyed as a pilot project for a larger survey to be conducted later. The numbers of people in the households are 3, 8, and 9. Consider the values of 3, 8, and 9 to be a population. Assume that samples of size n = 2 are randomly selected with replacement from the population of 3, 8, and 9. The nine different samples are as follows: (3, 3), (3, 8), (3, 9), (8, 3), (8, 8), (8, 9), (9, 3), (9, 8), and (9, 9). (i) Find the mean of each of the nine samples, then summarize the sampling distribution of the means in the format of a table representing the probability distribution. (ii) Compare the population mean to the mean of the sample means. (iii) Do the sample means target the value of the population mean? In general, do means make good estimators of population means? Why or why not?
(Essay)
4.9/5 (40)
Scores on a test have a mean of 71 and is 82 . The scores have a distribution that is approximately normal. Find P90. (You will need to first find the standard deviation.)
(Multiple Choice)
4.8/5 (38)
If z is a standard normal variable, find the probability.
-The probability that z is less than 1.13
(Multiple Choice)
4.8/5 (34)
The amount of snowfall falling in a certain mountain range is normally distributed with a mean of 89 inches, and a standard deviation of 14 inches. What is the probability that the mean annual snowfall during 49 randomly picked years will exceed 91.8 inches?
(Multiple Choice)
4.8/5 (34)
Which of the following notations represents the standard deviation of the population consisting of all sample means?
(Multiple Choice)
4.8/5 (38)
The Precision Scientific Instrument Company manufactures thermometers that are supposed to give readings of 0°C at the freezing point of water. Tests on a large sample of these thermometers reveal that at the freezing point of water, some give readings below 0°C (denoted by negative numbers) and some give readings above 0°C (denoted by positive numbers). Assume that the mean reading is 0°C and the standard deviation of the readings is 1.00°C. Also assume that the frequency distribution of errors closely resembles the normal distribution. A thermometer is randomly selected and tested. Find the temperature reading corresponding to the given information.
-Find P96, the 96th percentile.
(Multiple Choice)
4.8/5 (34)
The Precision Scientific Instrument Company manufactures thermometers that are supposed to give readings of 0°C at the freezing point of water. Tests on a large sample of these thermometers reveal that at the freezing point of water, some give readings below 0°C (denoted by negative numbers) and some give readings above 0°C (denoted by positive numbers). Assume that the mean reading is 0°C and the standard deviation of the readings is 1.00°C. Also assume that the frequency distribution of errors closely resembles the normal distribution. A thermometer is randomly selected and tested. Find the temperature reading corresponding to the given information.
-If 9% of the thermometers are rejected because they have readings that are too low, but all other thermometers are acceptable, find the temperature that separates the rejected thermometers from the others.
(Multiple Choice)
4.7/5 (35)
Flood insurance policies sold in the last three days by a new agent were 2, 5, and 7. Assume that samples of size 2 are randomly selected with replacement from this population of three values. List the different possible samples, and find the mean of each of them.
(Essay)
4.7/5 (42)
In a population of 225 women, the heights of the women are normally distributed with a mean of 64.5 inches and a standard deviation of 2.9 inches. If 25 women are selected at random, find the probability that their mean height will exceed 66 inches. Assume that the sampling is done without replacement and use a finite population correction factor with
(Multiple Choice)
4.9/5 (40)
Three randomly selected households are surveyed as a pilot project for a larger survey to be conducted later. The numbers of people in the households are 4, 6, and 9. Consider the values of 4, 6, and 9 to be a population. Assume that samples of size 2 are randomly selected with replacement from the population of 4, 6, and 9. The nine different samples are as follows:
(4, 4), (4, 6), (4, 9), (6, 4), (6, 6), (6, 9), (9, 4), (9, 6), and (9, 9).
(i) Find the standard deviation
of each of the nine samples, then summarize the sampling distribution of the standard deviations in the format of a table representing the probability distribution.
(ii) Compare the population standard deviation to the mean of the sample standard deviations.
(iii) Do the sample standard deviations target the value of the population standard deviation? In general, do standard deviations make good estimators of population standard deviation? Why or why not?
(Essay)
4.9/5 (46)
Use the normal distribution to approximate the desired probability.
-A coin is tossed 20 times. A person, who claims to have extrasensory perception, is asked to predict the outcome of each flip in advance. She predicts correctly on 11 tosses. What is the probability of being correct 11 or more times by guessing? Does this probability seem to verify her claim?
(Multiple Choice)
4.8/5 (36)
A study of the amount of time it takes a mechanic to rebuild the transmission for a 2005 Chevrolet Cavalier shows that the mean is 8.4 hours and the standard deviation is 1.8 hours. If 40 mechanics are randomly selected, find the probability that their mean rebuild time exceeds 7.7 hours.
(Multiple Choice)
4.9/5 (31)
If z is a standard normal variable, find the probability.
-P(z < 0.97)
(Multiple Choice)
4.8/5 (34)
Find the area of the shaded region. The graph depicts the standard normal distribution with mean 0 and standard deviation 1.
-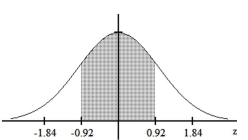
(Multiple Choice)
4.9/5 (35)
Provide an appropriate response.
Premises:
If selecting samples of si n=10 from a population with a known mean and standard deviation,
what requirement, if any, must be satisfied in order to assume that the distribution of the sample
means is a normal distribution?
what requirement, if any, must be satisfied in order to assume that the distribution of the sample
means is a normal distribution?
Responses:
None; the distribution of sample means will be approximately normal.
The population must have a normal distribution.
The population must have a standard deviation of 1.
Correct Answer: Verified
Premises:
Responses:
(Matching)
4.7/5 (33)
Find the area of the shaded region. The graph depicts IQ scores of adults, and those scores are normally distributed with a mean of 100 and a standard deviation of 15 (as on the Wechsler test). 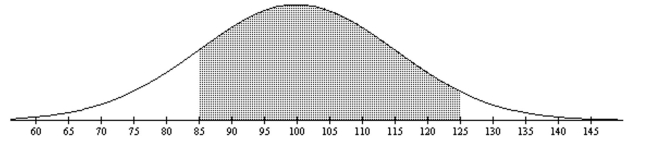
(Multiple Choice)
4.8/5 (37)
Filters
- Essay(0)
- Multiple Choice(0)
- Short Answer(0)
- True False(0)
- Matching(0)