Exam 2: Exploring Relationships Between Variables
Exam 1: Exploring and Understanding Data125 Questions
Exam 2: Exploring Relationships Between Variables165 Questions
Exam 3: Gathering Data111 Questions
Exam 4: Randomness and Probability148 Questions
Exam 5: From the Data at Hand to the World at Large128 Questions
Exam 6: Accessing Associations Between Variables93 Questions
Exam 7: Inference When Variables Are Related25 Questions
Exam 8: Regression, Associations, and Predictive Modeling792 Questions
Select questions type
A school board study found a moderately strong negative association between the number
of hours high school seniors worked at part-time jobs after school hours and the students'
grade point averages.
a. Explain in this context what "negative association" means.
b. Hoping to improve student performance, the school board passed a resolution urging
parents to limit the number of hours students be allowed to work. Do you agree or
disagree with the school board's reasoning. Explain.
(Essay)
4.8/5  (39)
(39)
Current research states that a good diet should contain 20-35 grams of dietary fiber. Research also states that each day should
start with a healthy breakfast. The nutritional information for 77 breakfast cereals was reviewed to find the grams of fiber and
the number of calories per serving. The scatterplot below shows the relationship between fiber and calories for the cereals. 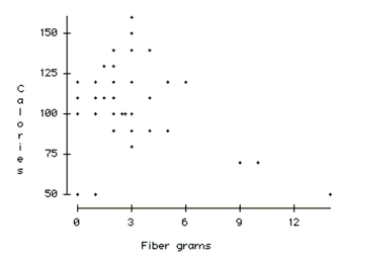 -Comment on any unusual data point or points in the data set. Explain.
(Essay)
4.8/5 (38)
Assembly line Your new job at Panasony is to do the final assembly of camcorders. As you
learn how, you get faster. The company tells you that you will qualify for a raise if after 13
weeks your assembly time averages under 20 minutes. The data shows your average
assembly time during each of your first 10 weeks. Week Time(min) 1 43 2 39 3 35 4 33 5 32 6 30 7 30 8 28 9 26 10 25
a. Which is the explanatory variable?
b. What is the correlation between these variables?
c. You want to predict whether or not you will qualify for that raise. Would it be
appropriate to use a linear model? Explain.
(Essay)
4.7/5 (26)
A regression analysis of company profits and the amount of money the company spent on
Advertising found
0)72 . Which of these is true?
I. This model can correctly predict the profit for 72% of companies.
II. On average, about 72% of a company's profit results from advertising.
III. On average, companies spend about 72% of their profits on advertising.
(Multiple Choice)
4.8/5 (35)
For families who live in apartments the correlation between the family's income and the amount of
Rent they pay is r = 0.60. Which is true?
I. In general, families with higher incomes pay more in rent.
II. On average, families spend 60% of their income on rent.
III. The regression line passes through 60% of the (income$, rent$) data points.
(Multiple Choice)
4.8/5 (35)
Mistakes. Describe the mistake made in the following analyses:
a. Ten teachers compute their average test scores for all their students. Then the
superintendent collects their data and finds the school average. He repeats this process for
eight different schools and finds a positive correlation between the age of the school
average age of the teachers at a school and their average score.
b. The mayor of a city is concerned that the population of the city is growing faster than
revenue. He calculates that over the last 5 years, the year and the size of the city have a
R-sq of 95.7%. With such a high value, the mayor confidently predicts the population for
the next three years of fiscal planning.
(Essay)
4.9/5 (51)
After conducting a survey at a pet store to see what impact having a pet had on the
condition of the yard, a news reporter stated "There appears to be a strong correlation
between the owning a pet and the condition of the yard." Comment on this observation.
(Essay)
5.0/5 (40)
A study examined the number of trees in a variety of orange groves and the corresponding number of oranges that each
grove produces in a given harvest year. Linear regression was calculated and the results are below. linear regression results:
Dependent Variable: oranges
Independent Variable: trees
Sample size: 9
-=0.886 =31394.7
Parameter Estimate Std. Err. Constant 390.59 16328.8 Trees 525.84 71.22
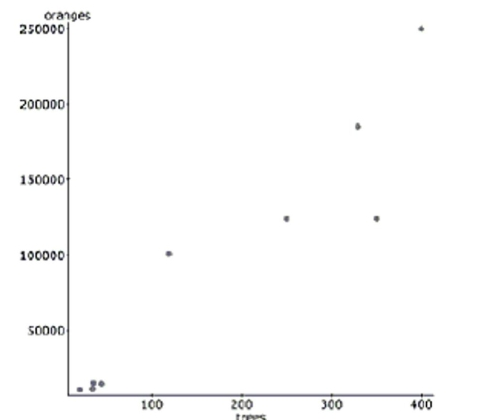 -Since
there must be other factors in influencing the number of oranges
harvested. What percentage is that and what is another factor you think might be
involved?
-Since
there must be other factors in influencing the number of oranges
harvested. What percentage is that and what is another factor you think might be
involved?
(Essay)
4.9/5 (38)
An article in the Journal of Statistics Education reported the price of diamonds of different sizes in Singapore dollars (SGD).
The following table contains a data set that is consistent with this data, adjusted to US dollars in 2004: 2004 US \ Carat 494.82 0.12 768.03 0.17 1105.03 0.20 1508.88 0.25 1826.18 0.28 2096.89 0.33
2004 US \ Carat 688.24 0.15 944.90 0.18 1071.75 0.21 1504.44 0.26 1908.28 0.29 2409.76 0.35
2004 US \ Carat 748.10 0.16 1076.18 0.19 1289.20 0.23 1597.63 0.27 2038.09 0.32
-Create a model to predict diamond costs from the size of the diamond.
(Essay)
4.7/5 (40)
The relationship between the longevity of an animal's life and its gestation time is 0.70. If an animal
Is one standard deviation below average in life expectancy, the gestation time is predicted to be
__?__ below average.
(Multiple Choice)
4.8/5 (46)
A regression analysis of students' AP* Statistics test scores and the number of hours they spent
Doing homework found
0)32 . Which of these is true?
I. 32% of student test scores can be correctly predicted with this model.
II. Homework accounts for 32% of your grade in AP* Stats.
III. There's a 32% chance that you'll get the score this model predicts for you.
(Multiple Choice)
4.9/5 (40)
Maple trees A forester would like to know how big a maple tree might be at age 50 years.
She gathers data from some trees that have been cut down, and plots the diameters (in
inches) of the trees against their ages (in years). First she makes a linear model. The
scatterplot and residuals plot are shown. 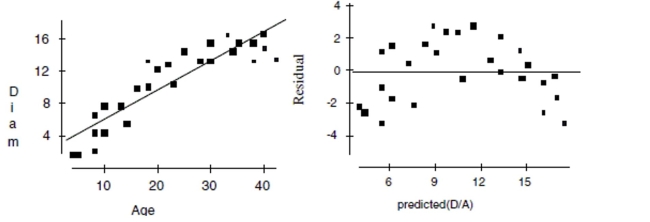 a. Describe the association shown in the scatterplot.
b. Do you think the linear model is appropriate? Explain.
c. If she uses this model to try to predict the diameter of a 50-year old maple tree, would
you expect that estimate to be fairly accurate, too low, or too high? Explain.
Now she re-expresses the data, using the logarithm of age to try to predict the diameter of
the tree. Here are the regression analysis and the residuals plot. Dependent variable is: Diam R squared =84.3\% Variable Coefficient s.e. of Coeff Constant -8.60770 1.681 Log ( Age ) 15.0701 1.299
a. Describe the association shown in the scatterplot.
b. Do you think the linear model is appropriate? Explain.
c. If she uses this model to try to predict the diameter of a 50-year old maple tree, would
you expect that estimate to be fairly accurate, too low, or too high? Explain.
Now she re-expresses the data, using the logarithm of age to try to predict the diameter of
the tree. Here are the regression analysis and the residuals plot. Dependent variable is: Diam R squared =84.3\% Variable Coefficient s.e. of Coeff Constant -8.60770 1.681 Log ( Age ) 15.0701 1.299
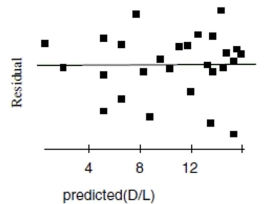 d. Explain why you think this is a better model.
e. Using this model, predict the diameter of a maple tree at age 50 years.
d. Explain why you think this is a better model.
e. Using this model, predict the diameter of a maple tree at age 50 years.
(Essay)
4.7/5 (39)
Crawling Researchers at the University of Denver Infant Study Center investigated
whether babies take longer to learn to crawl in cold months (when they are often bundled
in clothes that restrict their movement) than in warmer months. The study sought an
association between babies' first crawling age (in weeks) and the average temperature
during the month they first try to crawl (about 6 months after birth). Between 1988 and
1991 parents reported the birth month and age at which their child was first able to creep
or crawl a distance of four feet in one minute. Data were collected on 208 boys and 206
girls. The graph below plots average crawling ages (in weeks) against the mean
temperatures when the babies were 6 months old. The researchers found a correlation of r
= -0.70 and their line of best fit was 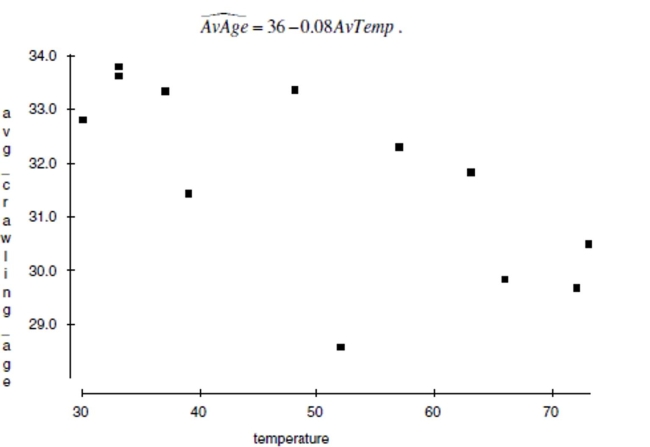 a. Draw the line of best fit on the graph. (Show your method clearly.)
b. Describe the association in context.
c. Explain (in context) what the slope of the line means.
d. Explain (in context) what the y-intercept of the line means.
e. Explain (in context) what
means.
f. In this context, what does a negative residual indicate?
a. Draw the line of best fit on the graph. (Show your method clearly.)
b. Describe the association in context.
c. Explain (in context) what the slope of the line means.
d. Explain (in context) what the y-intercept of the line means.
e. Explain (in context) what
means.
f. In this context, what does a negative residual indicate?
(Essay)
4.8/5 (32)
Which statement about influential points is true?
I. Removal of an influential point changes the regression line.
II. Data points that are outliers in the horizontal direction are more likely to be influential than
Points that are outliers in the vertical direction.
III. Influential points have large residuals.
(Multiple Choice)
4.8/5 (32)
The average movie ticket prices in selected years since 1948 are listed in the table below. Year Movie Ticket Price 1948 \ 0.36 1954 \ 0.49 1958 \ 0.68 1963 \ 0.86 1967 \ 1.22 1971 \ 1.65 1974 \ 1.89 1974 \ 2.03 1976 \ 2.13 1977 \ 2.23 1978 \ 2.34 1979 \ 2.47 1980 \ 2.69 1981 \ 2.78 1982 \ 2.94 1983 \ 3.15 1984 \ 3.36 1985 \ 3.55 1986 \ 3.71 1987 \ 3.91 1988 \ 4.11
a. Use re-expressed data to create a model that predicts ticket prices. (Hint: scale the year)
b. Find the movie ticket price this model predicts for 2004.
(Essay)
4.9/5 (37)
One of your classmates is reading through the program for Friday night''s football game.
Among other things, the program lists the players'' positions and their weights. Your
classmate comments, "There is a strong correlation between a player's position and their
weight."
a. Explain why your classmate's statement is in error.
b. What other variable might be listed in the program that could be used to correctly
identify a correlation with weight?
(Essay)
4.9/5 (37)
Penicillin assimilation Doctors studying how the human body assimilates medication
inject a patient with penicillin, and then monitor the concentration of the drug in the
patient's blood for several hours. The data are shown in the table. Time elapsed (Hours) Concentration (Units/cc) 1 42 2 28 3 19 4 13 5 9 6 6 7 4
a. Straighten the scatterplot by re-expressing these data and create an appropriate model
for predicting the concentration of penicillin.
b. Use your model to estimate what the concentration of penicillin will be after 8 hours.
(Essay)
4.8/5 (38)
Which of the following is not a goal of re-expressing data?
(Multiple Choice)
4.8/5 (31)
Find the value of the correlation coefficient and interpret this value in context.
(Essay)
4.8/5 (40)
Car commercials A car dealer investigated the association between the number of TV
commercials he ran each week and the number of cars he sold the following weekend. He
found the correlation to be
.56. During the time he collected the data he ran an average
of 12.4 commercials a week with a standard deviation of 1.8, and sold an average of 30.5
cars with a standard deviation of 4.2. Next weekend he is planning a sale, hoping to sell 40
cars. Create a linear model to estimate the number of commercials he should run this week.
Write a sentence explaining your recommendation.
(Essay)
5.0/5 (31)
Filters
- Essay(0)
- Multiple Choice(0)
- Short Answer(0)
- True False(0)
- Matching(0)