Exam 2: Exploring Relationships Between Variables
Exam 1: Exploring and Understanding Data125 Questions
Exam 2: Exploring Relationships Between Variables165 Questions
Exam 3: Gathering Data111 Questions
Exam 4: Randomness and Probability148 Questions
Exam 5: From the Data at Hand to the World at Large128 Questions
Exam 6: Accessing Associations Between Variables93 Questions
Exam 7: Inference When Variables Are Related25 Questions
Exam 8: Regression, Associations, and Predictive Modeling792 Questions
Select questions type
The following scatterplot shows the relationship between the time (in seconds) it took men
to run the 1500m race for the gold medal and the year of the Olympics that the race was
run in: 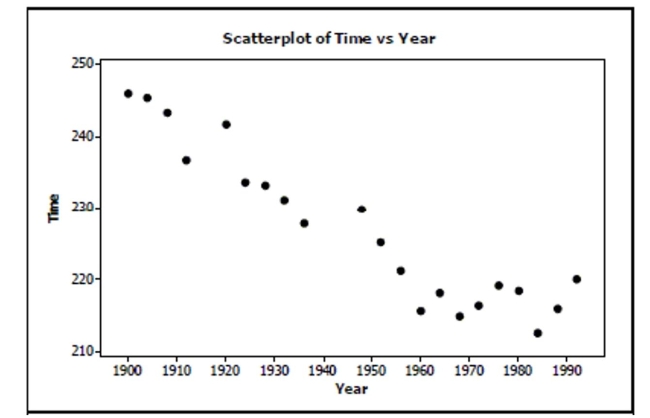 a. Write a few sentences describing the association.
b. Estimate the correlation. ________
a. Write a few sentences describing the association.
b. Estimate the correlation. ________
(Essay)
4.8/5  (33)
(33)
One your classmates is working on a science project for a unit on weather. She tracks the
temperature one day, beginning at sunrise and finishing at sunset. Given that you are
know for being the stats expert, she asks you about calculating the correlation for her data.
What is the best advice you could give her?
(Essay)
4.8/5 (40)
A medical researcher finds that the more overweight a person is, the higher his pulse rate tends to
Be) In fact, the model suggests that 12-pound differences in weight are associated with differences
In pulse rate of 4 beats per minute. Which is true?
I. The correlation between pulse rate and weight is 0.33
II. If you lose 6 pounds, your pulse rate will slow down 2 beats per minute.
III. A positive residual means a person's pulse rate is higher than the model predicts.
(Multiple Choice)
4.9/5 (46)
A study examined the number of trees in a variety of orange groves and the corresponding number of oranges that each
grove produces in a given harvest year. Linear regression was calculated and the results are below. linear regression results:
Dependent Variable: oranges
Independent Variable: trees
Sample size: 9
Parameter Estimate Std. Err. Constant 390.59 16328.8 Trees 525.84 71.22
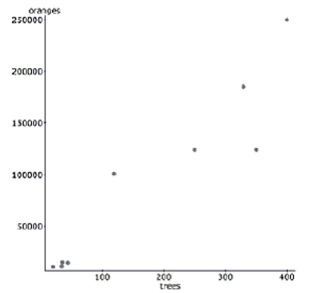 -Interpret the slope in context.
(Essay)
4.8/5 (47)
An 8th grade class develops a linear model that predicts the number of cheerios (a small round cereal) that fit on the
circumference of a plate by using the diameter in inches. Their model is chee^rios = 0.56 + 5.11(diameter).
-If the diameter is increased from 4 inches to 14 inches, the predicted number of cheerios will
Increase by about…
(Multiple Choice)
4.9/5 (29)
The correlation between a family's weekly income and the amount they spend on restaurant meals
Is found to be
Which must be true?
I. Families tend to spend about 30% of their incomes in restaurants.
II. In general, the higher the income, the more the family spends in restaurants.
III. The line of best fit passes through 30% of the (income, restaurant$) data points.
(Multiple Choice)
4.8/5 (38)
High Score The longer you play a video game, the higher score you can usually achieve.
An analysis of a popular game found the following relationship between the hours a
player has played a game and their corresponding high score on that game. Dependent variable is High Score
R-squared
with 89 degrees of freedom
Variable Coefficient s.e. of Coeff Constant 524.8 145.3 Hours 2498.8 324.5
a. Write the regression equation and define the variables of your equation in context.
b. Interpret the slope in context.
c. Interpret the y-intercept in context.
d. Interpret s in context.
e. What is the correlation coefficient? Interpret this value in context.
(Essay)
4.9/5 (32)
An article in the Journal of Statistics Education reported the price of diamonds of different sizes in Singapore dollars (SGD).
The following table contains a data set that is consistent with this data, adjusted to US dollars in 2004: 2004 US \ Carat 494.82 0.12 768.03 0.17 1105.03 0.20 1508.88 0.25 1826.18 0.28 2096.89 0.33
2004 US \ Carat 688.24 0.15 944.90 0.18 1071.75 0.21 1504.44 0.26 1908.28 0.29 2409.76 0.35
2004 US \ Carat 748.10 0.16 1076.18 0.19 1289.20 0.23 1597.63 0.27 2038.09 0.32
-What is the correlation between cost and size?
(Essay)
4.9/5 (47)
Variables X and Y have 0.40. If we decrease each X value by 0.1, double each Y value, and then
Interchange them (put X on the Y-axis and vice versa) the new correlation will be
(Multiple Choice)
4.9/5 (32)
In an effort to decide if there is an association between the year of a postal increase and the new postal rate for first class mail,
the data were gathered from the United States Postal Service. In 1981, the United States Postal Service changed their rates on
March 22 and November 1. This information is shown in the table. Year Rate 1971 0.08 1974 0.10 1975 0.13 1978 0.15 1981 0.18 1981 0.20 1985 0.22 1988 0.25 1991 0.29 1995 0.32
-Create a model to predict postal rates from the year.
(Essay)
4.8/5 (34)
A scatterplot of vs. x shows a strong positive linear pattern. It is probably true that
(Multiple Choice)
4.8/5 (42)
The model can be used to predict the breaking strength of a rope (in pounds) from
Its diameter (in inches). According to this model, how much force should a rope one-half inch in
Diameter be able to withstand?
(Multiple Choice)
4.9/5 (40)
If the point in the upper left corner of the scatterplot is removed, what will happen to the
Correlation (r) and the slope of the line of best fit (b)? 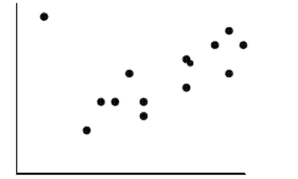
(Multiple Choice)
4.8/5 (29)
An article in the Journal of Statistics Education reported the price of diamonds of different sizes in Singapore dollars (SGD).
The following table contains a data set that is consistent with this data, adjusted to US dollars in 2004: 2004 US \ Carat 494.82 0.12 768.03 0.17 1105.03 0.20 1508.88 0.25 1826.18 0.28 2096.89 0.33
2004 US \ Carat 688.24 0.15 944.90 0.18 1071.75 0.21 1504.44 0.26 1908.28 0.29 2409.76 0.35
2004 US \ Carat 748.10 0.16 1076.18 0.19 1289.20 0.23 1597.63 0.27 2038.09 0.32
-Would it be better for a customer buying a diamond to have a negative residual or a
positive residual from this model? Explain.
(Essay)
4.8/5 (43)
A study examined the number of trees in a variety of orange groves and the corresponding number of oranges that each
grove produces in a given harvest year. Linear regression was calculated and the results are below. linear regression results:
Dependent Variable: oranges
Independent Variable: trees
Sample size: 9
-=0.886 =31394.7
Parameter Estimate Std. Err. Constant 390.59 16328.8 Trees 525.84 71.22
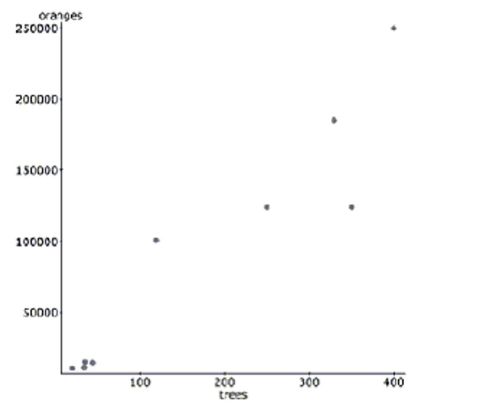 -The farmer with 35 had 15,400 oranges; find the value of his residual. Show your work.
(Essay)
4.9/5 (34)
A researcher notes that there is a positive correlation between the temperature on a
summer day and the number of bees that he can count in his garden over a 5-minute time
span.
a. Describe what the researcher means by a positive correlation.
b. If the researcher calculates the correlation coefficient using degrees Fahrenheit instead of
Celsius, will the value be different?
(Essay)
4.9/5 (32)
If the point in the upper right corner of this scatterplot is removed from the data set, then what will
Happen to the slope of the line of best fit (b) and to the correlation (r)? 
(Multiple Choice)
4.9/5 (40)
An 8th grade class develops a linear model that predicts the number of cheerios (a small round cereal) that fit on the
circumference of a plate by using the diameter in inches. Their model is chee^rios = 0.56 + 5.11(diameter).
-The slope of this model is best interpreted in context as…
(Multiple Choice)
4.9/5 (48)
Computer output in the scenario described in problem #8 reports that . Which is the correct
Interpretation of this value?
(Multiple Choice)
4.8/5 (38)
Filters
- Essay(0)
- Multiple Choice(0)
- Short Answer(0)
- True False(0)
- Matching(0)