Exam 2: Exploring Relationships Between Variables
Exam 1: Exploring and Understanding Data125 Questions
Exam 2: Exploring Relationships Between Variables165 Questions
Exam 3: Gathering Data111 Questions
Exam 4: Randomness and Probability148 Questions
Exam 5: From the Data at Hand to the World at Large128 Questions
Exam 6: Accessing Associations Between Variables93 Questions
Exam 7: Inference When Variables Are Related25 Questions
Exam 8: Regression, Associations, and Predictive Modeling792 Questions
Select questions type
If a data set has a relationship that is best described by a linear model, than the residual plot will
(Multiple Choice)
4.9/5  (41)
(41)
Researchers studying growth patterns of children collect data on the heights of fathers and sons.
The correlation between the fathers' heights and the heights of their 16 year-old sons is most likely
To be . . .
(Multiple Choice)
4.8/5 (27)
A plot of the residuals versus the fitted values for record-breaking times of female
marathon runners for the years 1998 - 2003 is: 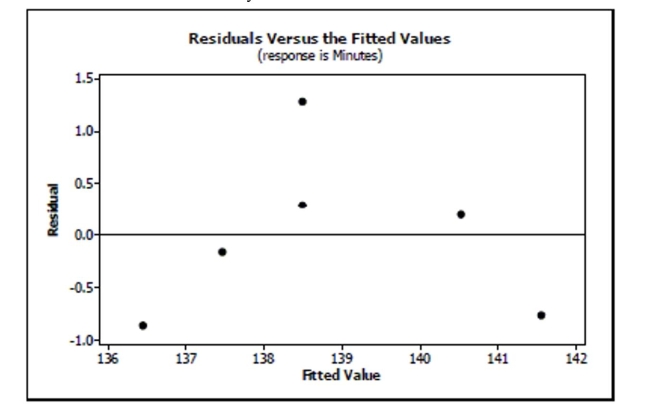 Based on this residuals plot, does it seem reasonable to use linear regression for this
model? Explain.
Based on this residuals plot, does it seem reasonable to use linear regression for this
model? Explain.
(Essay)
4.7/5 (45)
Which statement about re-expressing data is not true?
I. Unimodal distributions that are skewed to the left will be made more symmetric by taking the
Square root of the variable.
II. A curve in which the direction of the association changes from negative to positive
Will not benefit from re-expression.
III. One goal of re-expression may be to make the variability of the response variable more
Uniform.
(Multiple Choice)
4.8/5 (34)
A study examined the number of trees in a variety of orange groves and the corresponding number of oranges that each
grove produces in a given harvest year. Linear regression was calculated and the results are below. linear regression results:
Dependent Variable: oranges Independent Variable: trees
Sample size: 9
-=0.886 =31394.7
Parameter Estimate Std. Err. Constant 390.59 16328.8 Trees 525.84 71.22
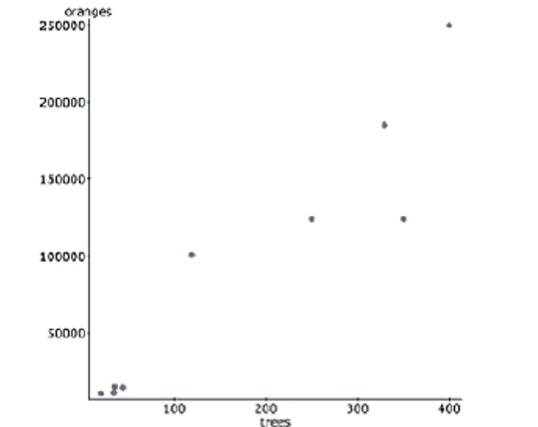 -If these data were collected in California, would you feel confident in using this equation to
make predictions about Florida orange groves also? Explain.
-If these data were collected in California, would you feel confident in using this equation to
make predictions about Florida orange groves also? Explain.
(Essay)
4.9/5 (46)
In an effort to decide if there is an association between the year of a postal increase and the new postal rate for first class mail,
the data were gathered from the United States Postal Service. In 1981, the United States Postal Service changed their rates on
March 22 and November 1. This information is shown in the table. Year Rate 1971 0.08 1974 0.10 1975 0.13 1978 0.15 1981 0.18 1981 0.20 1985 0.22 1988 0.25 1991 0.29 1995 0.32
-Interpret the slope of your model in context.
(Essay)
5.0/5 (39)
In an effort to decide if there is an association between the year of a postal increase and the new postal rate for first class mail,
the data were gathered from the United States Postal Service. In 1981, the United States Postal Service changed their rates on
March 22 and November 1. This information is shown in the table. Year Rate 1971 0.08 1974 0.10 1975 0.13 1978 0.15 1981 0.18 1981 0.20 1985 0.22 1988 0.25 1991 0.29 1995 0.32
-Interpret the intercept of your model in context.
(Essay)
5.0/5 (31)
Using the equation in number #8 again, if a homeowner doubles the number of lights he uses from
500 to 1000, how much do we predict he will increase his electric bill by?
(Multiple Choice)
4.9/5 (39)
An article in the Journal of Statistics Education reported the price of diamonds of different sizes in Singapore dollars (SGD).
The following table contains a data set that is consistent with this data, adjusted to US dollars in 2004: 2004 US \ Carat 494.82 0.12 768.03 0.17 1105.03 0.20 1508.88 0.25 1826.18 0.28 2096.89 0.33
2004 US\ Carat 688.24 0.15 944.90 0.18 1071.75 0.21 1504.44 0.26 1908.28 0.29 2409.76 0.35
2004 US \ Carat 748.10 0.16 1076.18 0.19 1289.20 0.23 1597.63 0.27 2038.09 0.32
-Interpret the intercept of your model in context.
(Essay)
4.8/5 (39)
On the axes below, sketch a scatterplot described: a. a strong negative association
 b. a strong association but is near 0
 c. a weak but positive association
(Essay)
4.8/5 (28)
A consumer group collected information on HDTVs . They created a linear model to estimate the
Cost of an HDTV (in $) based on the screen size (in inches). Which is the most likely value of the
Slope of the line of best fit?
(Multiple Choice)
4.8/5 (37)
Storks Data show that there is a positive association between the population of 17
European countries and the number of stork pairs in those countries.
a. Briefly explain what "positive association" means in this context.
b. Wildlife advocates want the stork population to grow, and jokingly suggest that citizens
should be encouraged to have children. As a statistician, what do you think of this
suggestion? Explain briefly.
(Essay)
4.8/5 (40)
The correlation coefficient between the hours that a person is awake during a 24-hour period and
The hours that same person is asleep during a 24-hour period is most likely to be
(Multiple Choice)
4.9/5 (38)
Current research states that a good diet should contain 20-35 grams of dietary fiber. Research also states that each day should
start with a healthy breakfast. The nutritional information for 77 breakfast cereals was reviewed to find the grams of fiber and
the number of calories per serving. The scatterplot below shows the relationship between fiber and calories for the cereals. 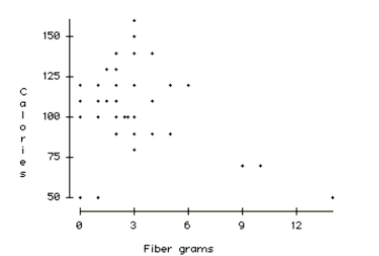 -Do you think a model could accurately predict the number of calories in a serving of cereal
that has 22 grams of fiber? Explain.
-Do you think a model could accurately predict the number of calories in a serving of cereal
that has 22 grams of fiber? Explain.
(Essay)
5.0/5 (44)
The bigger the stop sign, the more expensive it is. Here is a graph of the height of a sign in inches versus its cost in dollars. 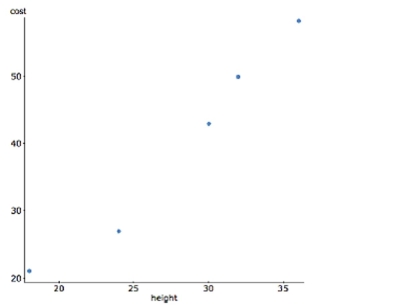 -Describe why performing linear regression with these data is not a good decision.
(Essay)
4.9/5 (35)
All but one of these statements contain a mistake. Which could be true?
(Multiple Choice)
4.8/5 (33)
Breaking strength A company manufactures polypropylene rope in six different sizes. To
assess the strength of the ropes they test two samples of each size to see how much force
(in kilograms) the ropes will hold without breaking. The table shows the results of the tests.
We want to create a model for predicting the breaking strength from the diameter of the
rope. Diameter () Strength () 4 60 76 7 157 153 10 254 262 12 334 388 15 551 529 20 938 893
a. Find a model that uses re-expressed data to straighten the scatterplot.
b. The company is thinking of introducing a new 25mm rope. How strong should it be?
(Write a sentence in context based on one of your models.)
(Essay)
4.9/5 (41)
Gas mileage again In the Data Desk lab last week you analyzed the association between a
car's fuel economy and its weight. Another important factor in the amount of gasoline a car
uses is the size of the engine. Called "displacement", engine size measures the volume of
the cylinders in cubic inches. The regression analysis is shown. Dependent variable is:
MPG
89 total cases of which 0 are missing
R squared R squared (adjusted)
with degrees of freedom
Source Sum of Squares df Mean Square F-ratio Regression 696.744 1 696.744 74.6 Residual 448.236 48 9.33826
Variable Coefficient s.e. of Coeff t-ratio prob Constant 34.9799 1.231 28.4 0.0001 Eng. Displcmt -0.066196 0.0077 -8.64 S 0.0001
a. How many cars were included in this analysis?
b. What is the correlation between engine size and fuel economy?
c. A car you are thinking of buying is available with two different size engines, 190 cubic
inches or 240 cubic inches. How much difference might this make in your gas mileage?
(Show work)
(Essay)
4.9/5 (31)
Which statement about residuals plots is true?
I. A curved pattern indicates nonlinear association between the variables.
II. A pattern of increasing spread indicates the predicted values become less reliable as the
Explanatory variable increases.
III. Randomness in the residuals indicates the model will predict accurately.
(Multiple Choice)
4.7/5 (46)
Filters
- Essay(0)
- Multiple Choice(0)
- Short Answer(0)
- True False(0)
- Matching(0)