Exam 2: Exploring Relationships Between Variables
Exam 1: Exploring and Understanding Data125 Questions
Exam 2: Exploring Relationships Between Variables165 Questions
Exam 3: Gathering Data111 Questions
Exam 4: Randomness and Probability148 Questions
Exam 5: From the Data at Hand to the World at Large128 Questions
Exam 6: Accessing Associations Between Variables93 Questions
Exam 7: Inference When Variables Are Related25 Questions
Exam 8: Regression, Associations, and Predictive Modeling792 Questions
Select questions type
In predicting the growth of the volume of a small bay by measuring the height of the water at a Dock, a researcher is using a model of  Where height is measured in m And volume cubic miles. If the height rises to 3.45 m, what is the predicted volume?
(Multiple Choice)
4.8/5  (34)
(34)
Researchers investigating the association between the size and strength of muscles
measured the forearm circumference (in inches) of 20 teenage boys. Then they measured
the strength of the boys' grips (in pounds). Their data are plotted. 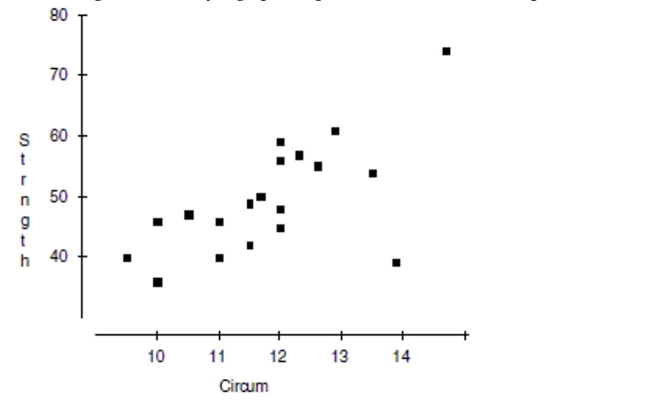 a. Write a few sentences describing the association.
b. Estimate the correlation. __________
c. If the point in the lower right corner (at about 14" and 38 lbs.) were removed, how would
the correlation become stronger, weaker, or remain about the same?
d. If the point in the upper right corner (at about 15" and 75 lbs.) were removed, would the
correlation become stronger, weaker, or remain about the same?
a. Write a few sentences describing the association.
b. Estimate the correlation. __________
c. If the point in the lower right corner (at about 14" and 38 lbs.) were removed, how would
the correlation become stronger, weaker, or remain about the same?
d. If the point in the upper right corner (at about 15" and 75 lbs.) were removed, would the
correlation become stronger, weaker, or remain about the same?
(Essay)
4.7/5 (29)
Which statement about correlation is true?
I. Regression based on data that are summary statistics tends to result in a higher correlation.
II. If
0)95, the response variable increases as the explanatory variable increases.
III. An outlier always decreases the correlation.
(Multiple Choice)
4.8/5 (34)
Another farmer has increased his wheat production by about the same percentage each year. His
Most useful predictive model is probably…
(Multiple Choice)
4.9/5 (29)
During a science lab, students heated water, allowed it to cool, and recorded the temperature over time. They computed the
difference between the water temperature and the room temperature. The results are in the table. Time (in minutes) 10 20 30 40 50 60 Difference in temp. (degrees F) 68 36 20 10 6 4
-Use the equation  = 2.057 - 0.025\) time to predict the difference in temperature at time 0 minutes. What does this value represent?
(Essay)
4.7/5 (30)
Personal debt According to The World Almanac and Book of Facts 2004, the debt per capita
for the years 1990-2001 gives the following scatterplot: 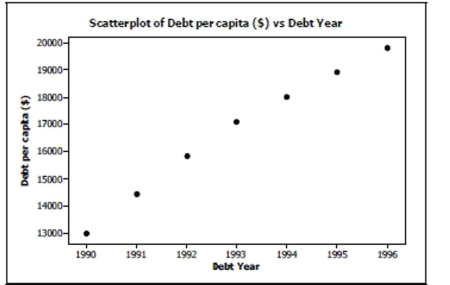 Regression output gives the equation of the regression line as
Debt Year with .
a. What is the response variable?
b. What is the correlation coefficient ?
c. Explain in context what the slope of the line means.
d. Explain in context what means.
e. You decide to take a look at a residuals plot before making any predictions. Based on the following residuals plot, does linear regression seem appropriate for these data?
Explain.
Regression output gives the equation of the regression line as
Debt Year with .
a. What is the response variable?
b. What is the correlation coefficient ?
c. Explain in context what the slope of the line means.
d. Explain in context what means.
e. You decide to take a look at a residuals plot before making any predictions. Based on the following residuals plot, does linear regression seem appropriate for these data?
Explain. 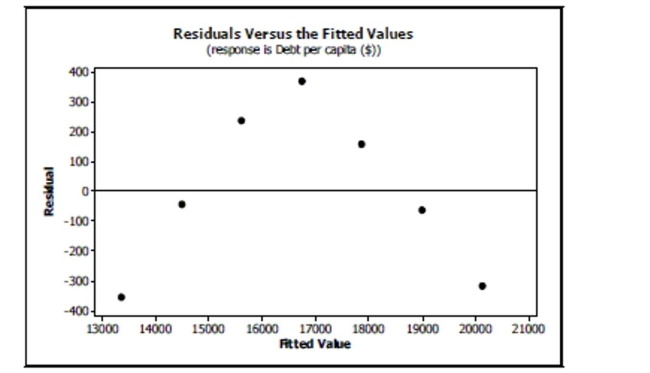
(Essay)
4.8/5 (33)
Baseball coaches use a radar gun to measure the speed of pitcher's fastball. They also record outcomes such as hits and
strikeouts. The scatterplot below shows the relationship between the average speed of a fastball and the average number of
strikeouts per nine innings for each pitcher on the Bulldogs, based on the past season.  -Do you think there is a pattern? Describe the association between speed and the number of
strikeouts.
-Do you think there is a pattern? Describe the association between speed and the number of
strikeouts.
(Essay)
4.8/5 (37)
Associations For each pair of variables, indicate what association you expect: positive
a. the number of miles a student lives from school; the student's GPA
b. a person's blood alcohol level; time it takes the person to solve a maze
c. weekly sales of hot chocolate at a Montana diner; the number of auto accidents that week
in that town
d. the price charged for fund-raising candy bars; number of candy bars sold
e. the amount of rainfall during growing season; the crop yield (bushels per acre)
(Essay)
4.8/5 (29)
A study examined the number of trees in a variety of orange groves and the corresponding number of oranges that each
grove produces in a given harvest year. Linear regression was calculated and the results are below. linear regression results:
Dependent Variable: oranges
Independent Variable: trees
Sample size: 9
Parameter Estimate Std. Err. Constant 390.59 16328.8 Trees 525.84 71.22
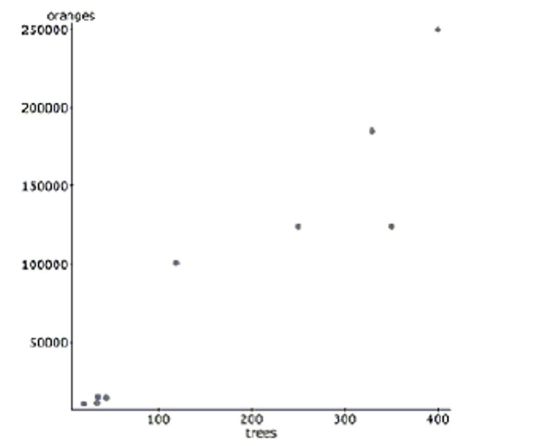 -Interpret s in context.
(Essay)
4.9/5 (31)
We can use the length of a man's hand span to predict his height, with a correlation coefficient of r
= 0)60. If change our measurements from cm to m, the new correlation will be
(Multiple Choice)
5.0/5 (35)
Associations For each pair of variables, indicate what association you expect: positive
a. the number of hours in the sun; the number of mold cultures on a piece of bread
b. the number of hours a store is open; the number of sales the store has
c. the number of hours you practice golf; your golf score
d. the price of gasoline; the number of families that take summer road trips
e. the size of a front lawn; the number of children who live in the house
(Essay)
5.0/5 (49)
All but one of the statements below contain a mistake. Which one could be true?
(Multiple Choice)
4.8/5 (35)
Suppose we collect data hoping to be able to estimate the prices of commonly owned new cars (in
$) from their lengths (in feet). Of these possibilities, the slope of the line of best fit is most likely to
Be
(Multiple Choice)
4.9/5 (33)
This regression analysis examines the relationship between the number of years of formal
Education a person has and their annual income. According to this model, about how much more
Money do people who finish a 4-year college program earn each year, on average, than those with
Only a 2-year degree? Dependent variable is Income
R-squared
with 57 degrees of freedom
Variable Coefficient s.e. of Coeff Constant 3984.45 6600 Education 2668.45 600.1
(Multiple Choice)
4.8/5 (32)
A study examined the number of trees in a variety of orange groves and the corresponding number of oranges that each
grove produces in a given harvest year. Linear regression was calculated and the results are below. linear regression results:
Dependent Variable: oranges
Independent Variable: trees
Sample size: 9
R-sq
Parameter Estimate Std. Err. Constant 390.59 16328.8 Trees 525.84 71.22
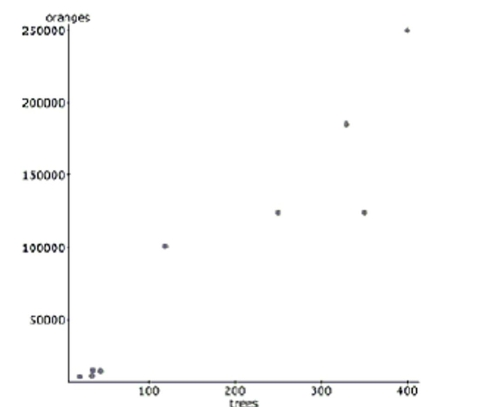 -Write the regression equation. Define all variables used in your equation.
(Essay)
4.8/5 (37)
Studying for exams A philosophy professor has found a correlation of 0.80 between the
number of hours students study for his exams and their exam performance. During the
time he collected the data, students studied an average of 10 hours with a standard
deviation of 2.5 hours, and scored an average of 80 points with a standard deviation of 7.5
points.
a. Create a linear model to estimate the number of points a student will score on the next
exam from the number of hours the student studies.
b. If a student studies for 15 hours, what score should the student expect on the next exam?
Show your work.
(Essay)
5.0/5 (49)
researcher studied the relationship between family income and amount of money spent on an
Automobile. She calculated that
Which is the correct interpretaion?
(Multiple Choice)
4.8/5 (29)
In an effort to decide if there is an association between the year of a postal increase and the new postal rate for first class mail,
the data were gathered from the United States Postal Service. In 1981, the United States Postal Service changed their rates on
March 22 and November 1. This information is shown in the table. Year Rate 1971 0.08 1974 0.10 1975 0.13 1978 0.15 1981 0.18 1981 0.20 1985 0.22 1988 0.25 1991 0.29 1995 0.32
-Make a scatterplot and describe the association between the year and the first class postal
rate.
(Essay)
4.9/5 (40)
Music and grades (True Story) A couple of years ago, a local newspaper published
research results claiming a positive association between the number of years high school
children had taken instrumental music lessons and their performances in school (GPA).
a. What does "positive association" mean in this context?
b. A group of parents then went to the School Board demanding more funding for music
programs as a way to improve student chances for academic success in high school. As a
statistician, do you agree or disagree with their reasoning? Explain briefly.
(Essay)
4.7/5 (36)
Blood pressure and cholesterol Suppose that both blood pressure and cholesterol levels of
adult women can be described with Normal models, and that the correlation between these
variables is 0.60. If a woman's blood pressure places her at the 88th percentile, at what
percentile would you predict her cholesterol level to be?
(Essay)
4.7/5 (35)
Filters
- Essay(0)
- Multiple Choice(0)
- Short Answer(0)
- True False(0)
- Matching(0)