Exam 2: Exploring Relationships Between Variables
Exam 1: Exploring and Understanding Data125 Questions
Exam 2: Exploring Relationships Between Variables165 Questions
Exam 3: Gathering Data111 Questions
Exam 4: Randomness and Probability148 Questions
Exam 5: From the Data at Hand to the World at Large128 Questions
Exam 6: Accessing Associations Between Variables93 Questions
Exam 7: Inference When Variables Are Related25 Questions
Exam 8: Regression, Associations, and Predictive Modeling792 Questions
Select questions type
The following scatterplot shows a relationship between x and y that results in a correlation
coefficient of
0 in this situation even though there appears to be a
strong relationship between the x and y variables. 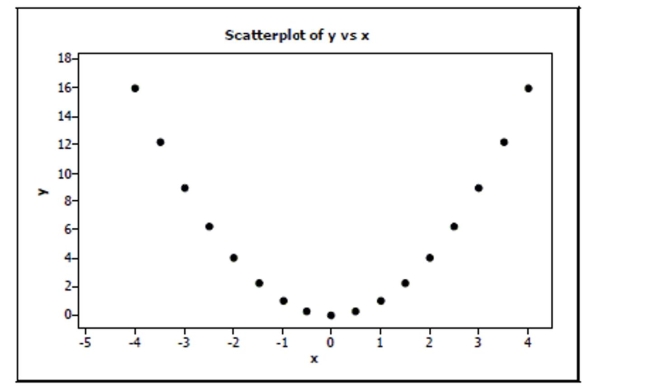
(Essay)
4.8/5  (39)
(39)
A regression model examining the amount of distance a long distance runner runs (in miles) to
Predict the amount of fluid the runner drinks (ounces) has a slope of 4.6. Which interpretation is
Appropriate?
(Multiple Choice)
4.9/5 (39)
The correlation between and is . If we double each value, decrease each by , and interchange the variables (put on the -axis and vice versa), the new correlation
(Multiple Choice)
4.7/5 (38)
A company's sales increase by the same amount each year. This growth is . . .
(Multiple Choice)
4.8/5 (31)
Filters
- Essay(0)
- Multiple Choice(0)
- Short Answer(0)
- True False(0)
- Matching(0)