Exam 11: Hypothesis Tests and Estimation for Population Variances
Exam 1: The Where, Why, and How of Data Collection167 Questions
Exam 2: Graphs, Charts and Tablesdescribing Your Data138 Questions
Exam 3: Describing Data Using Numerical Measures138 Questions
Exam 4: Introduction to Probability125 Questions
Exam 5: Discrete Probability Distributions161 Questions
Exam 6: Introduction to Continuous Probability Distributions122 Questions
Exam 7: Introduction to Sampling Distributions136 Questions
Exam 8: Estimating Single Population Parameters174 Questions
Exam 9: Introduction to Hypothesis Testing183 Questions
Exam 10: Estimation and Hypothesis Testing for Two Population Parameters121 Questions
Exam 11: Hypothesis Tests and Estimation for Population Variances69 Questions
Exam 12: Analysis of Variance162 Questions
Exam 13: Goodness-Of-Fit Tests and Contingency Analysis105 Questions
Exam 14: Introduction to Linear Regression and Correlation Analysis139 Questions
Exam 15: Multiple Regression Analysis and Model Building148 Questions
Exam 16: Analyzing and Forecasting Time-Series Data131 Questions
Exam 17: Introduction to Nonparametric Statistics103 Questions
Exam 18: Introducing Business Analytics48 Questions
Exam 19: Introduction to Decision Analysis48 Questions
Exam 20: Introduction to Quality and Statistical Process Control42 Questions
Select questions type
A one-tailed hypothesis test for a population variance always has the rejection region in the upper tail.
(True/False)
4.9/5  (30)
(30)
It is believed that the SAT scores for students entering two state universities may have different standard deviations. Specifically, it is believed that the standard deviation at University A is greater than the standard deviation at University B. To test this using an alpha = 0.05 level, a sample of 14 student SAT scores from University A was selected and a sample of 8 SAT scores from University B was selected. The following sample results were observed: 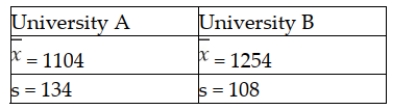 Based on this information, what is the value of the test statistic?
(Multiple Choice)
4.9/5 (36)
Assume a sample of size n = 12 has been collected. To perform a hypothesis test of a population variance using a 0.05 level of significance, where the null hypothesis is: H0 : σ2 = 25 The upper tail critical value is 21.92.
(True/False)
4.8/5 (25)
One of the major automobile makers has developed two new engines. At question is whether the two engines have the same variability with respect to miles per gallon. To test this, the following information is available: 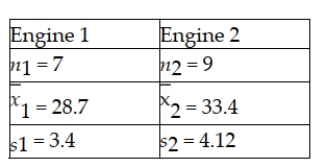 Based on this situation and the information provided, the appropriate null and alternative hypotheses are:
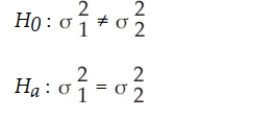
(True/False)
5.0/5 (30)
One of the key quality characteristics in many service environments is that the variation in service time be reasonably small. Recently, a major amusement park company initiated a new line system at one of its parks. It then wished to compare this new system with the old system in place at a comparable park in another state. At issue is whether the standard deviation in waiting time is less under the new line system than under the old line system. The following information was collected: 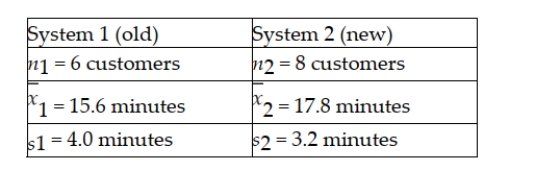 Assuming that it wishes to conduct the test using a 0.05 level of significance, the test statistic will be .
(True/False)
4.9/5 (35)
A machine that is used to fill soda pop cans with pop has an adjustable mean fill setting, but the standard deviation is not supposed to exceed 0.18 ounces. To make sure that this is the case, the managers at the beverage company each day select a random sample of n = 6 cans and measure the fill volume carefully. In one such case, the following data (ounces per can) were observed.  Based on these sample data, the test statistic is approximately χ2 = 5.01.
(True/False)
4.8/5 (39)
A potato chip manufacturer has two packaging lines and wants to determine if the variances differ between the two lines. They take samples of n1 = 10 bags from line 1 and n2 = 8 bags from line 2. To perform the hypothesis test at the 0.05 level of significance, the critical value is F = 3.68.
(True/False)
4.8/5 (40)
It is believed that the SAT scores for students entering two state universities may have different standard deviations. Specifically, it is believed that the standard deviation at University A is greater than the standard deviation at University B. To test this using an alpha = 0.05 level, a sample of 14 student SAT scores from University A was selected and a sample of 8 SAT scores from University B was selected. The following sample results were observed: 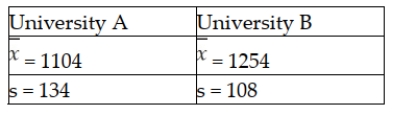 Based on this information, what is the critical value that will be used to test the hypothesis?
(Multiple Choice)
4.9/5 (38)
Which distribution is used in testing the hypotheses about the equality of two population variances?
(Multiple Choice)
4.9/5 (27)
Filters
- Essay(0)
- Multiple Choice(0)
- Short Answer(0)
- True False(0)
- Matching(0)