Exam 10: Correlation and Regression
Exam 1: Introduction to Statistics155 Questions
Exam 2: Exploring Data With Tables and Graphs132 Questions
Exam 3: Describing, Exploring, and Comparing Data225 Questions
Exam 4: Probability219 Questions
Exam 5: Discrete Probability Distributions205 Questions
Exam 6: Normal Probability Distributions254 Questions
Exam 7: Estimating Parameters and Determining Sample Sizes170 Questions
Exam 8: Hypothesis Testing187 Questions
Exam 9: Inferences From Two Samples192 Questions
Exam 10: Correlation and Regression174 Questions
Exam 11: Goodness-Of-Fit and Contingency Tables100 Questions
Exam 12: Analysis of Variance113 Questions
Exam 13: Nonparametric Tests121 Questions
Exam 14: Statistical Process Control90 Questions
Select questions type
Suppose you will perform a test to determine whether there is sufficient evidence to support a claim of a linear
correlation between two variables. Find the critical values of r given the number of pairs of data n and the significance
level
-Given: There is a significant linear correlation between the number of homicides in a town and the number of
movie theaters in a town.
Conclusion: Building more movie theaters will cause the homicide rate to rise.
(Essay)
5.0/5  (45)
(45)
Find the value of the linear correlation coefficient r.
-Managers rate employees according to job performance and attitude. The results for several randomly selected employees are given below. Performance 59 63 65 69 58 77 76 69 70 64 Attitude 72 67 78 82 75 87 92 83 87 78
(Multiple Choice)
4.8/5 (42)
Find the value of the linear correlation coefficient r.
-Two different tests are designed to measure employee productivity and dexterity. Several employees are randomly selected and tested with these results. Productivity 23 25 28 21 21 25 26 30 34 36 Dexterity 49 53 59 42 47 53 55 63 67 75
(Multiple Choice)
4.8/5 (35)
Give an example of a pair of variables whose linear correlation coefficient is likely to be close to zero.
(Essay)
4.9/5 (42)
Suppose there is significant correlation between two variables. Describe two cases under which it might be
inappropriate to use the linear regression equation for prediction. Give examples to support these cases.
(Essay)
4.8/5 (39)
Construct a scatterplot and identify the mathematical model that best fits the data. Assume that the model is to be used
only for the scope of the given data and consider only linear, quadratic, logarithmic, exponential, and power models. Use
a calculator or computer to obtain the regression equation of the model that best fits the data. You may need to fit several
models and compare the values of
-A rock is dropped from a tall building and its distance (in feet) below the point of release is recorded as accurately as possible at various times after the moment of release. The results are shown in the table. Find the
Regression equation of the best model. (seconds after release) 1 2 3 4 5 6 (distance in feet) 16 63 146 255 403 572
(Multiple Choice)
4.8/5 (42)
Based on the scatterplot, select the most likely value of the linear correlation coefficient r. 
(Multiple Choice)
4.7/5 (39)
Determine which scatterplot shows the strongest linear correlation.
-Which shows the strongest linear correlation?
(Multiple Choice)
4.8/5 (30)
A set of data consists of the number of years that applicants for foreign service jobs have studied German and
the grades that they received on a proficiency test. The following regression equation is obtained: ^y = 31.6 +
10.9x, where x represents the number of years of study and y represents the grade on the test. Identify the
predictor and response variables.
(Essay)
4.9/5 (32)
Use computer software to obtain the multiple regression equation and identify R , adjusted R , and the P-value.
-A visitor to Yellowstone National Park sat down one day and observed Old Faithful, which faithfully spurts throughout the day, day in and day out. He surmised that the height of a given spurt was caused by the
Pressure build-up during the interval between spurts and by the momentum build-up during the duration of
The spurt. He wrote down the data to test his hypothesis, but he didn't know what to do with his data. Can you
Help him out with his theory? HEIGHT INTERVAL DURATION 150 86 240 154 86 237 140 62 122 140 104 267 160 62 113 140 95 258 150 79 232 150 62 105 160 94 276 155 79 248 125 86 243 136 85 241 140 86 214 155 58 114 130 89 272 125 79 227 125 83 237 139 82 238 125 84 203 140 82 270 140 82 270 140 78 218 135 87 270 140 70 241 100 56 102 105 81 271
(Multiple Choice)
4.9/5 (42)
Find the coefficient of determination, given that the value of the linear correlation coefficient, r, is 0.611.
(Multiple Choice)
4.9/5 (47)
Use computer software to find the best multiple regression equation to explain the variation in the dependent variable, , in terms of the independent variables, .
Y 98.6 87.4 108.5 101.2 97.6 110.1 102.4 96.7 110.4 CORRELATION COEFFICIENTS 100.9 98.2 104.3 102.3 99.8 107.2 Y/=0.850 101.5 100.5 105.8 Y/=0.742 101.6 103.2 107.8 101.6 107.8 103.4 99.8 96.6 102.7 COEFFICIENT OF DETERMINATION 100.3 88.9 104.1 97.6 75.1 99.2 97.2 76.9 99.7 97.3 84.6 102.0 96.0 90.6 94.3 99.2 103.1 97.7 100.3 105.1 101.1 100.3 96.4 102.3 104.1 104.4 104.4 105.3 110.7 108.5 107.6 127.1 111.3
(Multiple Choice)
4.9/5 (41)
Construct a scatterplot for the given data.
- 11 -10 -19 5 -17 -4 -84 42 94 -52 78 12
(Multiple Choice)
4.7/5 (33)
The following are costs of advertising (in thousands of dollars) and the numbers of products sold (in thousands): Cost 9 2 3 4 2 5 9 10 Number 85 52 55 68 67 86 83 73 The equation of the regression line is ^y = 2.78846x + 55.7885. Find the coefficient of determination.
(Multiple Choice)
4.9/5 (35)
Find the explained variation for the paired data. The equation of the regression line for the paired data below is 9 7 2 3 4 22 17 43 35 16 21 23 102 81
(Multiple Choice)
4.9/5 (40)
Sketch an example of a residual plot that suggests that a regression equation is not a good model. Be sure to
include at least 10 points in your example.
(Essay)
4.8/5 (29)
Find the value of the linear correlation coefficient r.
- 47.0 46.6 27.4 33.2 40.9 8 10 10 5 10
(Multiple Choice)
4.8/5 (35)
Find the unexplained variation for the paired data.
-The equation of the regression line for the paired data below is . Find the unexplained variation.
9 7 2 3 4 22 17 43 35 16 21 23 102 81
(Multiple Choice)
4.9/5 (39)
Use the computer display to answer the question.
-A collection of paired data consists of the number of years that students have studied Spanish and their scores on a Spanish language proficiency test. A computer program was used to obtain the least squares linear
Regression line and the computer output is shown below. Along with the paired sample data, the program was
Also given an x value of 2 (years of study) to be used for predicting test score.
The regression equation is Score Years.
Predictor Coef StDev T P Constant 31.55 6.360 4.96 0.000 Years 10.90 1.744 6.25 0.000
Predicted values
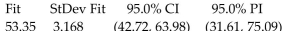 If a person studies 4.5 years, what is the single value that is the best predicted test score? Assume that there is a
Significant linear correlation between years of study and test score.
If a person studies 4.5 years, what is the single value that is the best predicted test score? Assume that there is a
Significant linear correlation between years of study and test score.
(Multiple Choice)
4.8/5 (41)
Filters
- Essay(0)
- Multiple Choice(0)
- Short Answer(0)
- True False(0)
- Matching(0)