Exam 10: Correlation and Regression
Exam 1: Introduction to Statistics155 Questions
Exam 2: Exploring Data With Tables and Graphs132 Questions
Exam 3: Describing, Exploring, and Comparing Data225 Questions
Exam 4: Probability219 Questions
Exam 5: Discrete Probability Distributions205 Questions
Exam 6: Normal Probability Distributions254 Questions
Exam 7: Estimating Parameters and Determining Sample Sizes170 Questions
Exam 8: Hypothesis Testing187 Questions
Exam 9: Inferences From Two Samples192 Questions
Exam 10: Correlation and Regression174 Questions
Exam 11: Goodness-Of-Fit and Contingency Tables100 Questions
Exam 12: Analysis of Variance113 Questions
Exam 13: Nonparametric Tests121 Questions
Exam 14: Statistical Process Control90 Questions
Select questions type
Solve the problem.
-A confidence interval for the -intercept for a regression line can be found by evaluating the limits in the interval below:
where The critical value is found from the t-table using degrees of freedom and is calculated in the usual way from the sample data.
Use the data below to obtain a confidence interval estimate of .
x (hours studied) 2.5 4.5 5.1 7.9 11.6 y (score on test) 66 70 60 83 93
(Multiple Choice)
4.9/5  (38)
(38)
Construct the indicated prediction interval for an individual y.
-The paired data below consists of test scores and hours of preparation for 5 randomly selected students. The equation of the regression line is and the standard error of estimate is se . Find the prediction interval for the test score of a person who spent 7 hours preparing for the test.
x Hours of preparation 5 2 9 6 10 Test score 64 48 72 73 80
(Multiple Choice)
4.8/5 (37)
Use the computer display to answer the question.
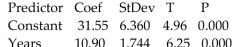
-A collection of paired data consists of the number of years that students have studied Spanish and their scores on a Spanish language proficiency test. A computer program was used to obtain the least squares linear Regression line and the computer output is shown below. Along with the paired sample data, the program was Also given an x value of 2 (years of study) to be used for predicting test score.
The regression equation is Score Years.
 Adj
Predicted values
Fit StDev Fit 95.0\% CI 95.0\% PI 53.35 3.168 (42.72,63.98) (31.61,75.09)
For a person who studies for 2 years, obtain the 95% prediction interval and write a statement interpreting the
Interval.
Adj
Predicted values
Fit StDev Fit 95.0\% CI 95.0\% PI 53.35 3.168 (42.72,63.98) (31.61,75.09)
For a person who studies for 2 years, obtain the 95% prediction interval and write a statement interpreting the
Interval.
(Multiple Choice)
4.9/5 (44)
Suppose you will perform a test to determine whether there is sufficient evidence to support a claim of a linear
correlation between two variables. Find the critical values of r given the number of pairs of data n and the significance
level
-Six pairs of data yield and the regression equation Also, . What is the best predicted value of for ?
(Multiple Choice)
4.9/5 (39)
Construct a scatterplot and identify the mathematical model that best fits the data. Assume that the model is to be used
only for the scope of the given data and consider only linear, quadratic, logarithmic, exponential, and power models. Use
a calculator or computer to obtain the regression equation of the model that best fits the data. You may need to fit several
models and compare the values of
- x 1 2 3 4 5 6 y 9 13 25 27 31 46
(Multiple Choice)
4.7/5 (40)
The following table gives the US domestic oil production rates (excluding Alaska) from 1987 to 2002. A
regression equation was fit to the data and the residual plot is shown below. 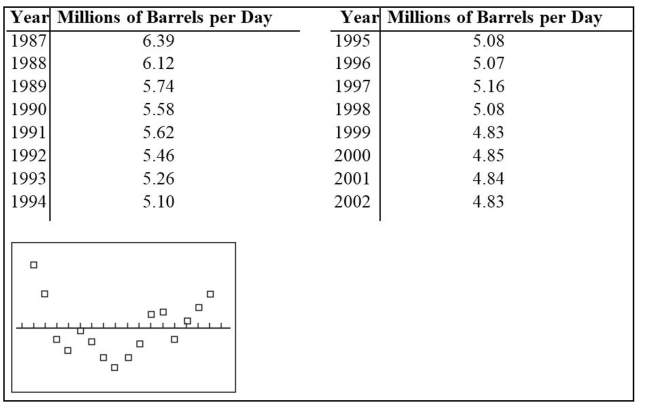 Does the residual plot suggest that the regression equation is a bad model? Why or why not?
(Essay)
4.9/5 (34)
Find the indicated multiple regression equation.
-Below are the results of two separate tests designed to measure a student's ability to solve problems. Test A 48 52 58 44 43 43 40 51 59 Test B 73 67 73 59 58 56 58 64 74 In addition to these results, a third test was designed to measure the same problem-solving ability, and the following results correspond to the same students.
Test C: 48 41 59 45 42 44 40 58 60
Find the multiple regression equation that expresses results from Test C in terms of Test A and Test B.
(Multiple Choice)
4.9/5 (41)
Nine adults were selected at random from among those working full time in the town of Workington.
Each person was asked the number of years of college education they had completed and was also asked to rate
their job satisfaction on a scale of 1 to 10.
The pairs of data values area plotted in the scatterplot below.  The four points in the lower left corner correspond to employees from company A and the five points in the
upper right corner correspond to employees from company B.
a. Using the pairs of values for all 9 points, find the equation of the regression line.
b. Using only the pairs of values for the four points in the lower left corner, find the equation of the regression
line.
c. Using only the pairs of values for the five points in the upper right corner, find the equation of the regression
line.
d. Compare the results from parts a, b, and c.
The four points in the lower left corner correspond to employees from company A and the five points in the
upper right corner correspond to employees from company B.
a. Using the pairs of values for all 9 points, find the equation of the regression line.
b. Using only the pairs of values for the four points in the lower left corner, find the equation of the regression
line.
c. Using only the pairs of values for the five points in the upper right corner, find the equation of the regression
line.
d. Compare the results from parts a, b, and c.
(Essay)
4.9/5 (35)
Find the explained variation for the paired data.
-The equation of the regression line for the paired data below is . Find the explained variation.
9 7 2 3 4 22 17 43 35 16 21 23 102 81
(Multiple Choice)
4.8/5 (39)
Suppose you will perform a test to determine whether there is sufficient evidence to support a claim of a linear
correlation between two variables. Find the critical values of r given the number of pairs of data n and the significance
level
-Six pairs of data yield and the regression equation Also, . What is the best predicted value of for ?
(Multiple Choice)
4.8/5 (42)
Construct the indicated prediction interval for an individual y.
-The paired data below consists of heights and weights of 6 randomly selected adults. The equation of the regression line is and the standard error of estimate is . Find the prediction interval for the weight of a person whose height is .
x Height (meters) 1.61 1.72 1.78 1.80 1.67 1.88 y Weight () 54 62 70 84 61 92
(Multiple Choice)
4.8/5 (32)
Suppose you will perform a test to determine whether there is sufficient evidence to support a claim of a linear
correlation between two variables. Find the critical values of r given the number of pairs of data n and the significance
level
-
(Multiple Choice)
4.8/5 (34)
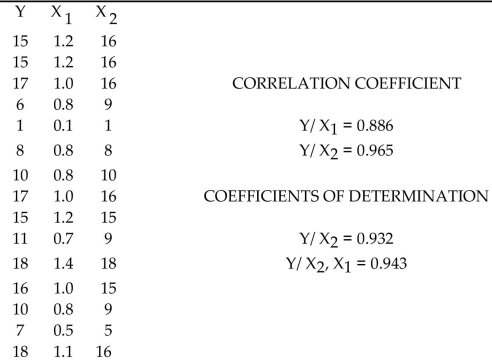
Use computer software to obtain the multiple regression equation and identify R , adjusted R , and the P-value.
-An anti-smoking group used data in the table to relate the carbon monoxide of various brands of cigarettes to their tar and nicotine content. CO TAR NIC 15 1.2 16 15 1.2 16 17 1.0 16 6 0.8 9 1 0.1 1 8 0.8 8 10 0.8 10 17 1.0 16 15 1.2 15 11 0.7 9 18 1.4 18 16 1.0 15 10 0.8 9 7 0.5 5 18 1.1 16
(Multiple Choice)
4.9/5 (38)
Find the indicated multiple regression equation.
-Below are the productivity, dexterity, and job satisfaction ratings of ten randomly selected employees.
Productivity 23 25 28 21 21 25 26 30 34 36 Dexterity 49 53 59 42 47 53 55 63 67 75 Job satisfaction 56 58 60 50 54 61 59 63 67 69
Find the multiple regression equation that expresses the job satisfaction scores in terms of the productivity and dexterity scores.
(Multiple Choice)
4.7/5 (43)
Use computer software to find the best multiple regression equation to explain the variation in the dependent variable, Y, in terms of the independent variables,
-
(Multiple Choice)
4.9/5 (48)
Construct the indicated prediction interval for an individual y.
-The regression equation for the given paired data is and the standard error of estimate is Find the prediction interval of for .
25 26 36 36 40 48 95 95 102 109 110 114
(Multiple Choice)
4.8/5 (33)
Use the given data to find the equation of the regression line. Round the final values to three significant digits, if necessary.
- 24 26 28 30 32 15 13 20 16 24
(Multiple Choice)
4.8/5 (38)
Is the data point, P, an outlier, an influential point, both, or neither?
-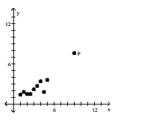
(Multiple Choice)
4.8/5 (29)
The following residual plot is obtained after a regression equation is determined for a set of data. Does the
residual plot suggest that the regression equation is a bad model? Why or why not? 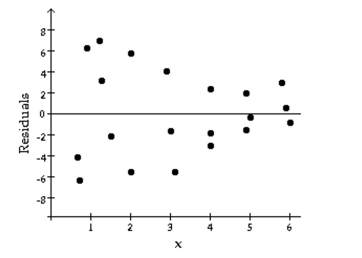
(Essay)
4.8/5 (40)
Find the explained variation for the paired data.
-The equation of the regression line for the paired data below is x. Find the explained variation. x 2 4 5 6 y 7 11 13 20
(Multiple Choice)
4.8/5 (45)
Filters
- Essay(0)
- Multiple Choice(0)
- Short Answer(0)
- True False(0)
- Matching(0)