Exam 10: Correlation and Regression
Exam 1: Introduction to Statistics155 Questions
Exam 2: Exploring Data With Tables and Graphs132 Questions
Exam 3: Describing, Exploring, and Comparing Data225 Questions
Exam 4: Probability219 Questions
Exam 5: Discrete Probability Distributions205 Questions
Exam 6: Normal Probability Distributions254 Questions
Exam 7: Estimating Parameters and Determining Sample Sizes170 Questions
Exam 8: Hypothesis Testing187 Questions
Exam 9: Inferences From Two Samples192 Questions
Exam 10: Correlation and Regression174 Questions
Exam 11: Goodness-Of-Fit and Contingency Tables100 Questions
Exam 12: Analysis of Variance113 Questions
Exam 13: Nonparametric Tests121 Questions
Exam 14: Statistical Process Control90 Questions
Select questions type
Use the given data to find the equation of the regression line. Round the final values to three significant digits, if necessary. x 1 3 5 7 9 y 143 116 100 98 90
(Multiple Choice)
4.8/5  (37)
(37)
Find the value of the linear correlation coefficient r.
-The paired data below consist of the temperatures on randomly chosen days and the amount a certain kind of plant grew (in millimeters): Temp 62 76 50 51 71 46 51 44 79 Growth 36 39 50 13 33 33 17 6 16
(Multiple Choice)
4.8/5 (35)
Find the coefficient of determination, given that the value of the linear correlation coefficient, r, is 0.738.
(Multiple Choice)
4.9/5 (42)
A 0.01 significance level is being used to test a correlation between two variables. If the linear correlation coefficient r is found to be 0.591 and the critical values are r = ±0.590 what can you conclude?
(Multiple Choice)
4.9/5 (42)
Find the value of the linear correlation coefficient r.
- 57 53 59 61 53 56 60 156 164 163 177 159 175 151
(Multiple Choice)
4.9/5 (30)
Solve the problem.
-After obtaining a regression line , a confidence interval for the mean of all values for which can be obtained as follows:
where
The critical value is found from the t-table using degrees of freedom.
Use the data below to obtain a confidence interval estimate of the mean test score of all students who study hours. Note that the equation of the regression line is and that .
x (hours studied) 2.5 4.5 5.1 7.9 11.6 (score on test) 66 70 60 83 93
(Multiple Choice)
4.9/5 (41)
The residual is the ________ the observed value of y and the predicted value of y.
(Multiple Choice)
4.9/5 (29)
Is the data point, P, an outlier, an influential point, both, or neither?
-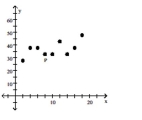
(Multiple Choice)
4.8/5 (33)
Is the data point, P, an outlier, an influential point, both, or neither?
-The regression equation for a set of paired data is . The correlation coefficient for the data is . A new data point, , is added to the set.
(Multiple Choice)
4.9/5 (40)
A regression equation is obtained for a collection of paired data. It is found that the total variation is 110.7, the explained variation is 93.3, and the unexplained variation is 17.4. Find the coefficient of determination.
(Multiple Choice)
4.8/5 (33)
The sample data below are the typing speeds (in words per minute) and reading speeds (in words per minute)
of nine randomly selected secretaries. Here, x denotes typing speed, and y denotes reading speed. x 60 56 52 63 70 58 44 79 62 370 551 528 348 645 454 503 618 500 The regression equation was obtained. Construct a residual plot for the data. 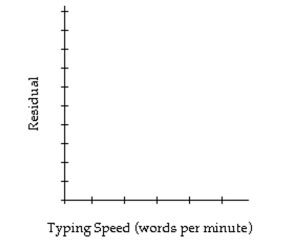
(Essay)
4.8/5 (28)
Solve the problem.
-In the context of regression, determine whether the following statement is true or false: If there is a very strong correlation between x and y, the amount of unexplained variation should be relatively
Large.
(Multiple Choice)
4.7/5 (44)
Use the given data to find the best predicted value of the response variable. Ten pairs of data yield r = 0.003 and the regression equation . What is the best predicted value of y for x = 2?
(Multiple Choice)
4.7/5 (31)
Use the given data to find the equation of the regression line. Round the final values to three significant digits, if necessary.
- 0 3 4 5 12 8 2 6 9 12
(Multiple Choice)
4.8/5 (34)
Filters
- Essay(0)
- Multiple Choice(0)
- Short Answer(0)
- True False(0)
- Matching(0)