Exam 10: Correlation and Regression
Exam 1: Introduction to Statistics155 Questions
Exam 2: Exploring Data With Tables and Graphs132 Questions
Exam 3: Describing, Exploring, and Comparing Data225 Questions
Exam 4: Probability219 Questions
Exam 5: Discrete Probability Distributions205 Questions
Exam 6: Normal Probability Distributions254 Questions
Exam 7: Estimating Parameters and Determining Sample Sizes170 Questions
Exam 8: Hypothesis Testing187 Questions
Exam 9: Inferences From Two Samples192 Questions
Exam 10: Correlation and Regression174 Questions
Exam 11: Goodness-Of-Fit and Contingency Tables100 Questions
Exam 12: Analysis of Variance113 Questions
Exam 13: Nonparametric Tests121 Questions
Exam 14: Statistical Process Control90 Questions
Select questions type
A(n) ________ is a point that strongly affects the graph of the regression line.
(Multiple Choice)
4.8/5  (43)
(43)
Find the value of the linear correlation coefficient r.
- 62 53 64 52 52 54 58 158 176 151 164 164 174 162
(Multiple Choice)
4.9/5 (38)
Find the value of the linear correlation coefficient r.
-The paired data below consist of the costs of advertising (in thousands of dollars) and the number of products sold (in thousands): Cost 9 2 3 4 2 5 9 10 Number 85 52 55 68 67 86 83 73
(Multiple Choice)
4.9/5 (47)
Use computer software to obtain the multiple regression equation and identify , adjusted , and the P-value. An anti-smoking group used data in the table to relate the carbon monoxide (CO) of various brands of cigarettes to their tar and nicotine (NIC) content. CO TAR NIC 15 1.2 16 15 1.2 16 17 1.0 16 6 0.8 9 1 0.1 1 8 0.8 8 10 0.8 10 17 1.0 16 15 1.2 15 11 0.7 9 18 1.4 18 16 1.0 15 10 0.8 9 7 0.5 5 18 1.1 16
(Multiple Choice)
5.0/5 (36)
Use computer software to find the multiple regression equation. Can the equation be used for prediction?
-A wildlife analyst gathered the data in the table to develop an equation to predict the weights of bears. He used WEIGHT as the dependent variable and CHEST, LENGTH, and SEX as the independent variables. For SEX, he
Used male=1 and female=2. WEIGHT CHEST LENGTH SEX 344 45.0 67.5 1 416 54.0 72.0 1 220 41.0 70.0 2 360 49.0 68.5 1 332 44.0 73.0 1 140 32.0 63.0 2 436 48.0 72.0 1 132 33.0 61.0 2 356 48.0 64.0 2 150 35.0 59.0 1 202 40.0 63.0 2 365 50.0 70.5 1
(Multiple Choice)
4.9/5 (38)
Solve the problem.
-A confidence interval for the slope for a regression line can be found by evaluating the limits in the interval below:
where The critical value is found from the -table using degrees of freedom and is calculated in the usual way from the sample data.
Use the data below to obtain a confidence interval estimate of .
x (hours studied) 2.5 4.5 5.1 7.9 11.6 y (score on test) 66 70 60 83 93
(Multiple Choice)
4.8/5 (41)
Solve the problem.
-In the context of regression, determine whether the following statement is true or false: If there is no correlation between x and y, the best predicted value of y for a given value of x is
(Multiple Choice)
4.8/5 (41)
Suppose you will perform a test to determine whether there is sufficient evidence to support a claim of a linear
correlation between two variables. Find the critical values of r given the number of pairs of data n and the significance
level
-
(Multiple Choice)
4.8/5 (41)
A(n) ________ is a point lying far away from other data points on a scatterplot.
(Multiple Choice)
4.7/5 (40)
Use the given data to find the equation of the regression line. Round the final values to three significant digits, if necessary.
- 6 8 20 28 36 2 4 13 20 30
(Multiple Choice)
4.9/5 (46)
Find the value of the linear correlation coefficient r. The paired data below consist of the costs of advertising (in thousands of dollars) and the number of products sold (in thousands). Cost 9 2 3 4 2 5 9 10 Number 85 52 55 68 67 86 83 73
(Multiple Choice)
4.9/5 (37)
Use the computer display to answer the question.
-A collection of paired data consists of the number of years that students have studied Spanish and their scores on a Spanish language proficiency test. A computer program was used to obtain the least squares linear
Regression line and the computer output is shown below. Along with the paired sample data, the program was
Also given an x value of 2 (years of study) to be used for predicting test score.
The regression equation is
Predictor Coef StDev T P Constant 31.55 6.360 4.96 0.000 Years 10.90 1.744 6.25 0.000
 What percentage of the total variation in test scores is unexplained by the linear relationship between years of
Study and test scores?
What percentage of the total variation in test scores is unexplained by the linear relationship between years of
Study and test scores?
(Multiple Choice)
4.8/5 (37)
A 0.05 significance level is being used to test a correlation between two variables. If the linear correlation coefficient r is found to be 0.591 and the critical values are 878, what can you conclude?
(Multiple Choice)
4.8/5 (37)
For the data below, determine the value of the linear correlation coefficient r between y and . 1.2 2.7 4.4 6.6 9.5 1.6 4.7 9.9 24.5 39.0
(Multiple Choice)
4.8/5 (39)
Suppose you will perform a test to determine whether there is sufficient evidence to support a claim of a linear
correlation between two variables. Find the critical values of r given the number of pairs of data n and the significance
level
-For the data below, determine the value of the linear correlation coefficient r between y and ln x and test
whether the linear correlation is significant. Use a significance level of 0.05. x 1.2 2.7 4.4 6.6 9.5 y 1.6 4.7 8.9 9.5 12.0
(Essay)
4.8/5 (41)
Use the given data to find the equation of the regression line. Round the final values to three significant digits, if necessary.
-Two different tests are designed to measure employee productivity and dexterity. Several employees are randomly selected and tested with these results.
Productivity 23 25 28 21 21 25 26 30 34 36 Dexterity 49 53 59 42 47 53 55 63 67 75
(Multiple Choice)
4.9/5 (34)
Use computer software to obtain the multiple regression equation. Use the estimated equation to find the predicted value.
-A health specialist gathered the data in the table to see if pulse rates can be explained by exercise and smoking. For exercise, he assigns 1 for yes, 2 for no. For smoking, he assigns 1 for yes, 2 for no. He then used his results to
Predict the pulse rate of a person whose exercise value was 1 and whose smoking value was 1. PULSE EXERCISE SMOKE 97 2 2 88 1 2 69 1 2 67 1 2 83 1 2 77 1 2 66 2 2 78 2 2 73 1 1 67 1 1 55 1 2 82 1 1 70 1 2 55 1 2 76 1 2
(Multiple Choice)
4.7/5 (43)
Use computer software to obtain the multiple regression equation and identify R , adjusted R , and the P-value.
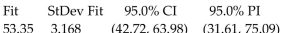
-A study of food consumption in the country related the level of food consumed to an index of food prices and an index of personal disposable income. 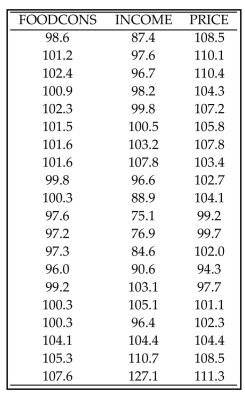
(Multiple Choice)
4.9/5 (36)
Use computer software to obtain the multiple regression equation and identify R , adjusted R , and the P-value.
-A wildlife analyst gathered the data in the table to develop an equation to predict the weights of bears. He used WEIGHT as the dependent variable and CHEST, LENGTH, and SEX as the independent variables. For SEX, he
Used male=1 and female=2. WEIGHT CHEST LENGTH SEX 344 45.0 67.5 1 416 54.0 72.0 1 220 41.0 70.0 2 360 49.0 68.5 1 332 44.0 73.0 1 140 32.0 63.0 2 436 48.0 72.0 1 132 33.0 61.0 2 356 48.0 64.0 2 150 35.0 59.0 1 202 40.0 63.0 2 365 50.0 70.5 1
(Multiple Choice)
4.9/5 (35)
Find the value of the linear correlation coefficient r.
-Two separate tests are designed to measure a student's ability to solve problems. Several students are randomly selected to take both tests and the results are shown below. Test A 48 52 58 44 43 43 40 51 59 Test B 73 67 73 59 58 56 58 64 74
(Multiple Choice)
4.7/5 (39)
Filters
- Essay(0)
- Multiple Choice(0)
- Short Answer(0)
- True False(0)
- Matching(0)