Exam 10: Correlation and Regression
Exam 1: Introduction to Statistics155 Questions
Exam 2: Exploring Data With Tables and Graphs132 Questions
Exam 3: Describing, Exploring, and Comparing Data225 Questions
Exam 4: Probability219 Questions
Exam 5: Discrete Probability Distributions205 Questions
Exam 6: Normal Probability Distributions254 Questions
Exam 7: Estimating Parameters and Determining Sample Sizes170 Questions
Exam 8: Hypothesis Testing187 Questions
Exam 9: Inferences From Two Samples192 Questions
Exam 10: Correlation and Regression174 Questions
Exam 11: Goodness-Of-Fit and Contingency Tables100 Questions
Exam 12: Analysis of Variance113 Questions
Exam 13: Nonparametric Tests121 Questions
Exam 14: Statistical Process Control90 Questions
Select questions type
Construct the indicated prediction interval for an individual y.
-The equation of the regression line for the paired data below is and the standard error of estimate is . Find the prediction interval of for .
9 7 2 3 4 22 17 43 35 16 21 23 102 81
(Multiple Choice)
4.9/5  (32)
(32)
The following table gives the US domestic oil production rates (excluding Alaska) over the past few years. A
regression equation was fit to the data and the residual plot is shown below. 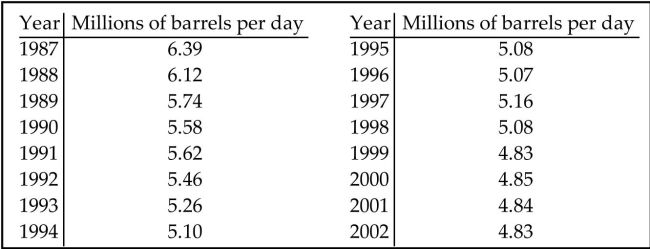
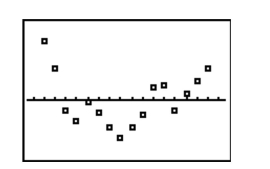 Does the residual plot suggest that the regression equation is a bad model? Why or why not?
(Essay)
4.9/5 (44)
Given the linear correlation coefficient r and the sample size n, determine the critical values of r and use your finding to state whether or not the given r represents a significant linear correlation. Use a significance level of
0)05.
(Multiple Choice)
4.9/5 (31)
Use the given data to find the equation of the regression line. Round the final values to three significant digits, if necessary.
-Ten students in a graduate program were randomly selected. Their grade point averages (GPAs) when they entered the program were between 3.5 and 4.0. The following data were obtained regarding their GPAs on Entering the program versus their current GPAs. Entering GPA Current GPA 3.5 3.6 3.8 3.7 3.6 3.9 3.6 3.6 3.5 3.9 3.9 3.8 4.0 3.7 3.9 3.9 3.5 3.8 3.7 4.0
(Multiple Choice)
4.9/5 (39)
Use the given data to find the equation of the regression line. Round the final values to three significant digits, if necessary.
- 1.2 1.4 1.6 1.8 2.0 54 53 55 54 56
(Multiple Choice)
4.9/5 (38)
Suppose you will perform a test to determine whether there is sufficient evidence to support a claim of a linear
correlation between two variables. Find the critical values of r given the number of pairs of data n and the significance
level
-Four pairs of data yield and the regression equation . Also, . What is the best predicted value of for ?
(Multiple Choice)
4.9/5 (33)
Suppose you will perform a test to determine whether there is sufficient evidence to support a claim of a linear
correlation between two variables. Find the critical values of r given the number of pairs of data n and the significance
level
-Based on the data from six students, the regression equation relating number of hours of preparation (x) and test score is . The same data yield and . What is the best predicted test score for a student who spent 2 hours preparing for the test?
(Multiple Choice)
4.9/5 (32)
Find the indicated multiple regression equation. Below are performance and attitude ratings of employees. Performance 59 63 65 69 58 77 76 69 70 64 Attitude 72 67 78 82 75 87 92 83 87 78 Managers also rate the same employees according to adaptability, and below are the results that correspond to those given above. Adaptability: 50 52 54 60 46 67 66 59 62 55
Find the multiple regression equation that expresses performance in terms of attitude and adaptability.
(Multiple Choice)
4.9/5 (32)
Determine which scatterplot shows the strongest linear correlation.
-Which shows the strongest linear correlation?
(Multiple Choice)
4.7/5 (46)
Construct a scatterplot and identify the mathematical model that best fits the data. Assume that the model is to be used
only for the scope of the given data and consider only linear, quadratic, logarithmic, exponential, and power models. Use
a calculator or computer to obtain the regression equation of the model that best fits the data. You may need to fit several
models and compare the values of
-The sum of squares of residuals can be used to assess the quality of a regression model. A residual is
the difference between an observed y value and the value of y predicted from the model, . The better the
model, the smaller the sum of squares of residuals. For the data below find the sum of squares of residuals
which results from fitting a linear model, and the sum of squares of residuals which results from fitting a
logarithmic model. Which model fits better? How can you tell? x 1 2 3 4 5 y 7 17 20 25 28
(Essay)
4.8/5 (36)
Find the value of the linear correlation coefficient r. The paired data below consist of the costs of advertising (in thousands of dollars) and the number of products sold (in thousands): Cost 9 2 3 4 2 5 9 10 Number 85 52 55 68 67 86 83 73
(Multiple Choice)
4.9/5 (40)
Find the explained variation for the paired data.
-The paired data below consists of test scores and hours of preparation for 5 randomly selected students. The equation of the regression line is . Find the explained variation.
x Hours of preparation 5 2 9 6 10 y Test of score 64 48 72 73 80
(Multiple Choice)
4.9/5 (42)
Use the computer display to answer the question.
-A collection of paired data consists of the number of years that students have studied Spanish and their scores on a Spanish language proficiency test. A computer program was used to obtain the least squares linear
Regression line and the computer output is shown below. Along with the paired sample data, the program was
Also given an x value of 2 (years of study) to be used for predicting test score.
The regression equation is 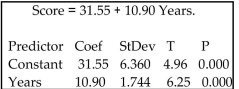 Predicted values
Fit StDev Fit 95.0\% CI 95.0\% PI 53.35 3.168 (42.72,63.98) (31.61,75.09)
Use the information in the display to find the value of the linear correlation coefficient r. Determine whether
There is significant linear correlation between years of study and test scores. Use a significance level of 0.05.
There are 10 pairs of data.
Predicted values
Fit StDev Fit 95.0\% CI 95.0\% PI 53.35 3.168 (42.72,63.98) (31.61,75.09)
Use the information in the display to find the value of the linear correlation coefficient r. Determine whether
There is significant linear correlation between years of study and test scores. Use a significance level of 0.05.
There are 10 pairs of data.
(Multiple Choice)
4.9/5 (28)
Given the linear correlation coefficient r and the sample size n, determine the critical values of r and use your finding to state whether or not the given r represents a significant linear correlation. Use a significance level of
0.05.R = 0.543, n = 25
(Multiple Choice)
4.9/5 (28)
Find the unexplained variation for the paired data.
-
2 4 5 6 7 11 13 20
(Multiple Choice)
4.7/5 (35)
Determine which plot shows the strongest linear correlation.
(Multiple Choice)
4.8/5 (36)
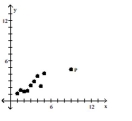
Is the data point, P, an outlier, an influential point, both, or neither?
-The regression equation for a set of paired data is . The values of run from 100 to 400 . A new data point, , is added to the set.
(Multiple Choice)
4.9/5 (35)
Is the data point, P, an outlier, an influential point, both, or neither?
-
(Multiple Choice)
4.8/5 (40)
Provide an appropriate response. For the data below, determine the logarithmic equation, that best fits the data. Hint: Begin by replacing each x-value with ln x then use the usual methods to find the equation of The least squares regression line. x 1.2 2.7 4.4 6.6 9.5 y 1.6 4.7 8.9 9.5 12.0
(Multiple Choice)
4.8/5 (39)
Use the given data to find the equation of the regression line. Round the final values to three significant digits, if necessary.
- x 1 3 5 7 9 y 143 116 100 98 90
(Multiple Choice)
4.8/5 (38)
Filters
- Essay(0)
- Multiple Choice(0)
- Short Answer(0)
- True False(0)
- Matching(0)