Exam 10: Correlation and Regression
Exam 1: Introduction to Statistics155 Questions
Exam 2: Exploring Data With Tables and Graphs132 Questions
Exam 3: Describing, Exploring, and Comparing Data225 Questions
Exam 4: Probability219 Questions
Exam 5: Discrete Probability Distributions205 Questions
Exam 6: Normal Probability Distributions254 Questions
Exam 7: Estimating Parameters and Determining Sample Sizes170 Questions
Exam 8: Hypothesis Testing187 Questions
Exam 9: Inferences From Two Samples192 Questions
Exam 10: Correlation and Regression174 Questions
Exam 11: Goodness-Of-Fit and Contingency Tables100 Questions
Exam 12: Analysis of Variance113 Questions
Exam 13: Nonparametric Tests121 Questions
Exam 14: Statistical Process Control90 Questions
Select questions type
Based on the scatterplot, select the most likely value of the linear correlation coefficient r.
(Multiple Choice)
4.9/5  (31)
(31)
Find the indicated multiple regression equation.
-A fitness rating was obtained for 9 randomly selected adult women. Each person was also asked her age, weight, and the number of hours she spent exercising each week. The results are shown below.
Age 39 27 41 48 56 59 22 64 35 Weight 140 129 137 125 162 152 118 142 126 Hours of exercise per week 2 6 4 9 0 3 11 3 4 Fitness rating 72 88 63 84 47 52 90 31 64
Identify the multiple regression equation that expresses fitness in terms of age, weight, and hours of exercise per week.
(Multiple Choice)
4.8/5 (41)
The table below shows the population of a city (in millions) in each year during the period 2010-2015. Using the
number of years since 2010 as the independent variable, find the regression equation of the best model. Assume
that the model is to be used only for the scope of the given data, and consider only linear, quadratic,
logarithmic, exponential, and power models. Include the type of model and the equation for the model you find. Year 2010 2011 2012 2013 2014 2015 Population(millions) 1.08 1.37 1.68 2.19 2.73 3.34
(Essay)
4.7/5 (36)
Solve the problem.
-A regression equation can be used to make predictions of the y value corresponding to a particular x value. Determine whether the following statement is true or false:
The 95% confidence interval for the mean of all values of y for whic will be wider than the 95%
Confidence interval for a single y for which
(Multiple Choice)
4.8/5 (40)
Find the value of the linear correlation coefficient r. The paired data below consist of the temperatures on randomly chosen days and the amount a certain kind of plant grew (in millimeters). Temperature 62 76 50 51 71 46 51 44 79 Growth 36 39 50 13 33 33 17 6 16
(Multiple Choice)
4.8/5 (36)
A quadratic regression model is fit to a set of sample data consisting of 6 pairs of data. Given that the sum of squares of residuals is 29.73 and that the y-values are 11, 14, 19, 22, 26, 27, find
(Multiple Choice)
4.8/5 (32)
Use the given information to find the coefficient of determination. A regression equation is obtained for a collection of paired data. It is found that the total variation is 20.711, the explained variation is 18.592, and the
Unexplained variation is 2.119.
(Multiple Choice)
4.8/5 (39)
For each of 200 randomly selected cities, Pete recorded the number of churches in the city (x) and the number of
homicides in the past decade (y). He calculated the linear correlation coefficient and was surprised to find a
strong positive linear correlation for the two variables. Does this suggest that building new churches causes an
increase in the number of homicides? Why do you think that a strong positive linear correlation coefficient was
obtained? Explain your answer with reference to the term lurking variable.
(Essay)
5.0/5 (30)
Use computer software to find the multiple regression equation. Can the equation be used for prediction? An anti-smoking group used data in the table to relate the carbon monoxide (CO) of various brands of cigarettes to
Their tar and nicotine (NIC) content. CO TAR NIC 15 1.2 16 15 1.2 16 17 1.0 16 6 0.8 9 1 0.1 1 8 0.8 8 10 0.8 10 17 1.0 16 15 1.2 15 11 0.7 9 18 1.4 18 16 1.0 15 10 0.8 9 7 0.5 5 18 1.1 16
(Multiple Choice)
4.9/5 (35)
Find the explained variation for the paired data.
-The paired data below consists of heights and weights of 6 randomly selected adults. The equation of the regression line is . Find the explained variation.
x Height (meters) 1.61 1.72 1.78 1.80 1.67 1.88 y Weight () 54 62 70 84 61 92
(Multiple Choice)
4.9/5 (41)
Find the indicated multiple regression equation.
-A fitness rating was obtained for 9 randomly selected adult women. Each person was also asked her age, weight, and the number of hours she spent exercising each week. The results are shown below.
Age 39 27 41 48 56 59 22 64 35 Weight 140 129 137 125 162 152 118 142 126 Hours of exercise per week 2 6 4 9 0 3 11 3 4 Fitness rating 72 88 63 84 47 52 90 31 64
Identify the multiple regression equation that expresses fitness in terms of age and hours of exercise per week.
(Multiple Choice)
4.7/5 (39)
Suppose you will perform a test to determine whether there is sufficient evidence to support a claim of a linear
correlation between two variables. Find the critical values of r given the number of pairs of data n and the significance
level
-The regression equation relating dexterity scores (x) and productivity scores (y) for the employees of a company is . Ten pairs of data were used to obtain the equation. The same data yield and . What is the best predicted productivity score for a person whose dexterity score is 33 ?
(Multiple Choice)
4.8/5 (33)
Find the unexplained variation for the paired data.
-The paired data below consists of heights and weights of 6 randomly selected adults. The equation of the regression line is . Find the unexplained variation.
x Height (meters) 1.61 1.72 1.78 1.80 1.67 1.88 y Weight () 54 62 70 84 61 92
(Multiple Choice)
4.9/5 (41)
A regression equation is obtained for a collection of paired data. It is found that the total variation is 20.711, the explained variation is 18.592, and the unexplained variation is 2.119. Find the coefficient of determination.
(Multiple Choice)
4.8/5 (40)
A regression equation is obtained for a set of data. After examining a scatter diagram, the researcher notices a
data point that is potentially an influential point. How could she confirm that this data point is indeed an
influential point?
(Essay)
4.8/5 (26)
Suppose you will perform a test to determine whether there is sufficient evidence to support a claim of a linear
correlation between two variables. Find the critical values of r given the number of pairs of data n and the significance
level
-Given: Each school in a state reports the average SAT score of its students. There is a significant linear
correlation between the average SAT score of a school and the average annual income in the district in which
the school is located.
Conclusion: There is a significant linear correlation between individual SAT scores and family income.
(Essay)
4.8/5 (42)
Construct a scatterplot for the given data.
- x -3 -2 -1 -4 -2 6 2 9 -5 -1 y -7 -3 -2 1 2 1 -5 2 -4 -4 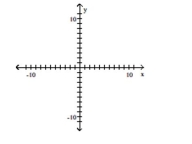
(Multiple Choice)
4.7/5 (36)
For the data below, determine the logarithmic equation, that best fits the data. Hint: Begin by replacing each x-value with ln x then use the usual methods to find the equation of the least squares regression
Line. 1.2 2.7 4.4 6.6 9.5 1.6 4.7 8.9 9.5 12.0
(Multiple Choice)
4.7/5 (45)
The following residual plot is obtained after a regression equation is determined for a set of data. Does the
residual plot suggest that the regression equation is a bad model? Why or why not? 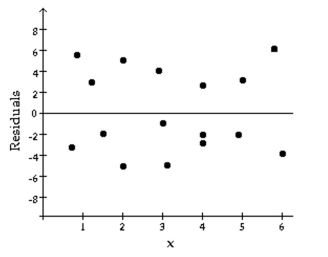
(Essay)
4.9/5 (40)
Filters
- Essay(0)
- Multiple Choice(0)
- Short Answer(0)
- True False(0)
- Matching(0)