Exam 16: Decision Making and Payoff Tables in Investment Scenarios
Exam 1: What Is Statistics79 Questions
Exam 2: Describing Data: Frequencydistributions and Graphic Presentation100 Questions
Exam 3: Describing Data: Numerical Measures214 Questions
Exam 4: Describing Data: Displaying and Exploring Pata138 Questions
Exam 5: A Sulvey of Probability Concepts121 Questions
Exam 6: Discrete Probability Distributions145 Questions
Exam 7: Continuous Probabilitydistributions79 Questions
Exam 8: Sampling Methods and the Central Umit Theorem134 Questions
Exam 9: Estimation and Confidence Intervals140 Questions
Exam 10: One-Sample Tests of Hypothesis111 Questions
Exam 11: Two Sample Tests of Hypothesis103 Questions
Exam 12: Analysis of Variance173 Questions
Exam 13: Linear Regression and Correlation132 Questions
Exam 14: Multiple Regression and Correlation Analysis126 Questions
Exam 15: Chi-Square Applications94 Questions
Exam 16: Decision Making and Payoff Tables in Investment Scenarios151 Questions
Select questions type
What time series component was exemplified during the 1980's when the World economy enjoyed a
Period of prosperity?
(Multiple Choice)
4.9/5  (33)
(33)
i. The reason for deseasonalizing a sales series is to remove trend and cyclical fluctuations so that
We can study seasonal fluctuations.
ii. Using the ratio-to-moving-average method, dividing the actual sales for a month by the typical
Seasonal for that month results in a figure that includes only trend, cycle and irregular fluctuations.
This procedure is called deseasonalizing the sales.
iii. Knowing the seasonal pattern in the form of indexes allows the retailer to deseasonalize sales.
This is accomplished by dividing the actual sales for a month by the typical index for that month.
(Multiple Choice)
4.9/5 (37)
You have a decision to invest $10,000 in any of four different companies. You estimate the
Probabilities that the economy will be favorable or unfavorable and you estimate the percent
Returns over the next year. 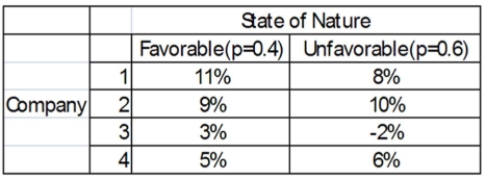 Which company is chosen using the maximax criterion?
(Multiple Choice)
4.8/5 (40)
You are trying to decide in which of the three companies you should invest. Refer to the following
Payoff Table. 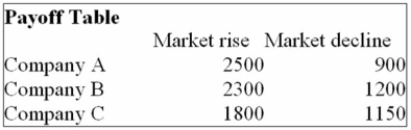 If the probability of the Market rising in the next year is 0.60, which of the following statements are
Correct?
i. The Expected Monetary Value for Company A is $1,860.
ii. The Expected Monetary Value for Company B is $1,860.
iii. The Expected Monetary Value for Company C is $1,860.
If the probability of the Market rising in the next year is 0.60, which of the following statements are
Correct?
i. The Expected Monetary Value for Company A is $1,860.
ii. The Expected Monetary Value for Company B is $1,860.
iii. The Expected Monetary Value for Company C is $1,860.
(Multiple Choice)
4.8/5 (33)
You are trying to decide in which of the three companies you should invest. Refer to the following
Payoff Table.  If the probability of the Market rising in the next year is 0.60, which of the following statements are
Correct?
i. The Expected Monetary Value for Company A is $1,860.
ii. The Expected Monetary Value for Company B is $1,860.
iii. The Expected Monetary Value for Company C is $1,540.
If the probability of the Market rising in the next year is 0.60, which of the following statements are
Correct?
i. The Expected Monetary Value for Company A is $1,860.
ii. The Expected Monetary Value for Company B is $1,860.
iii. The Expected Monetary Value for Company C is $1,540.
(Multiple Choice)
4.8/5 (38)
You are trying to decide in which of the three companies you should invest. Refer to the following
Payoff Table. 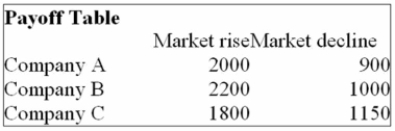 If the probability of the market declining in the next year is 0.5, which of the following statements
Are correct?
i. The Expected Opportunity Loss for Company A is $120.
ii. The Expected Opportunity Loss for Company B is $75.
iii. The Expected Opportunity Loss for Company C is $200.
If the probability of the market declining in the next year is 0.5, which of the following statements
Are correct?
i. The Expected Opportunity Loss for Company A is $120.
ii. The Expected Opportunity Loss for Company B is $75.
iii. The Expected Opportunity Loss for Company C is $200.
(Multiple Choice)
4.8/5 (37)
In the linear trend equation, how is the average change in the dependent variable represented for
Every unit change in time?
(Multiple Choice)
4.9/5 (39)
What is the general equation for the logarithmic trend equation is log  =
=
(Multiple Choice)
4.9/5 (40)
i. EVPI = Expected value under conditions of certainty-Optimal decision under conditions of
Uncertainty.
ii. Three regret strategies that are often used are Maximin, Maximax, and Minimax.
iii. Rankings of the decision alternatives are frequently not highly sensitive to changes in the applied
Probabilities within a plausible range.
(Multiple Choice)
4.9/5 (29)
The following linear trend equation was developed for annual sales from 1995 to 2001 with 1995 the
Base or zero year. ŷ = 500 + 60t ($000). What are the estimated sales for 2005 ($000)?
(Multiple Choice)
4.8/5 (35)
A plastics manufacturing performed a quarterly time series analysis for demands over the last five
Years (periods 1 through 20). The analysis resulted in the following trend equation and seasonal
Indexes:  = 920.0 + 22.6 t
 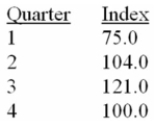 Using the trend line question and the seasonal indexes, predict demand for the third period of the
Next year, i.e., period 23.
Using the trend line question and the seasonal indexes, predict demand for the third period of the
Next year, i.e., period 23.
(Multiple Choice)
4.8/5 (37)
The Westberg Electric Company sells electric motors. The monthly trend equation, based on four
Years of monthly data, is Y' = 4.4 + 0.5t. The seasonal factor for the month of April is 98. Determine
The seasonally adjusted forecast for April of the fifth year.
(Multiple Choice)
4.9/5 (39)
Given the payoff table below, determine the profit and size of warehouse that would be built, using
The maximin criterion. 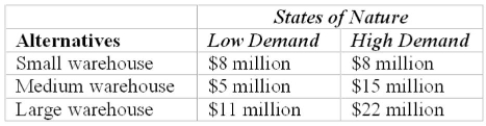
(Multiple Choice)
4.8/5 (48)
i. A typical monthly seasonal index of 107.0 indicates that sales (or whatever the variable is) are 7
Percent above the annual average.
ii. Seasonal variation is quite common in the retail and wholesale industries.
iii. A typical seasonal index of 103.7 for January indicates that sales for January are below the
Annual average.
(Multiple Choice)
4.9/5 (46)
The Westberg Electric Company sells electric motors. The monthly trend equation, based on four
Years of monthly data, is Y' = 4.4 + 0.5t. The seasonal factor for the month of March is 100.
Determine the seasonally adjusted forecast for March of the fifth year.
(Multiple Choice)
4.8/5 (40)
i. In the linear trend equation, the letter "b" is the average change in t for each change of one unit
(either increase or decrease) in y.
ii. In the linear trend equation, t is any value that corresponds with a time period, i.e., month or
Quarter.
iii. The least squares method of computing the equation for a straight line going through the data of
Interest gives the "best fitting" line.
(Multiple Choice)
4.7/5 (27)
The table below shows the sales for a plastics manufacturer recorded over the past year. The
Seasonal indexes for each quarter are also provided). To track the trend for these four quarters, use
The indexes to deseasonalize the sales data) 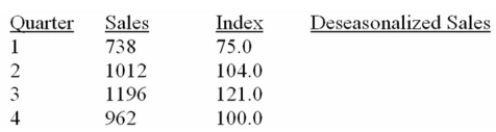 What are deseasonalized sales for quarter 2?
(Multiple Choice)
4.8/5 (37)
Teton Village contains shops, restaurants and motels. They have two peak seasons, - winter for
Skiing, and summer, for tourists visiting nearby parks. The specific seasonal with respect to the total
Sales volume for recent years are: 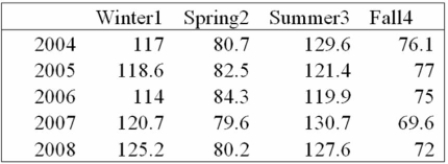 Using the seasonal indexes below, explain the typical index for the fall season.
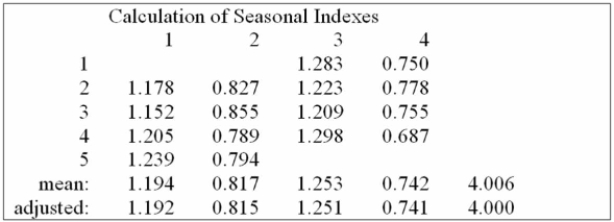
(Multiple Choice)
4.8/5 (31)
i. In the ratio-to-moving-average procedure, using the median or modified mean eliminates trend.
ii. A typical seasonal index of 103.7 for January indicates that sales for January are below the annual
Average.
iii. The total of the four typical quarterly indexes should equal 100.0.
(Multiple Choice)
4.7/5 (38)
Filters
- Essay(0)
- Multiple Choice(0)
- Short Answer(0)
- True False(0)
- Matching(0)