Exam 16: Decision Making and Payoff Tables in Investment Scenarios
Exam 1: What Is Statistics79 Questions
Exam 2: Describing Data: Frequencydistributions and Graphic Presentation100 Questions
Exam 3: Describing Data: Numerical Measures214 Questions
Exam 4: Describing Data: Displaying and Exploring Pata138 Questions
Exam 5: A Sulvey of Probability Concepts121 Questions
Exam 6: Discrete Probability Distributions145 Questions
Exam 7: Continuous Probabilitydistributions79 Questions
Exam 8: Sampling Methods and the Central Umit Theorem134 Questions
Exam 9: Estimation and Confidence Intervals140 Questions
Exam 10: One-Sample Tests of Hypothesis111 Questions
Exam 11: Two Sample Tests of Hypothesis103 Questions
Exam 12: Analysis of Variance173 Questions
Exam 13: Linear Regression and Correlation132 Questions
Exam 14: Multiple Regression and Correlation Analysis126 Questions
Exam 15: Chi-Square Applications94 Questions
Exam 16: Decision Making and Payoff Tables in Investment Scenarios151 Questions
Select questions type
i. In the linear trend equation, t is any value that corresponds with a time period, i.e., month or
Quarter.
ii. The least squares method of computing the equation for a straight line going through the data of
Interest gives the "best fitting" line.
iii. If the sales, production or other data over a period of time tend to approximate a straight-line
Trend, the equation developed by the least squares method cannot be used to forecast sales for a
Future period.
(Multiple Choice)
4.7/5  (34)
(34)
The following table lists the average price of home listings in Canada from January 2007 to January
2014. (See Connect for Data Set 7: CREA 2014). 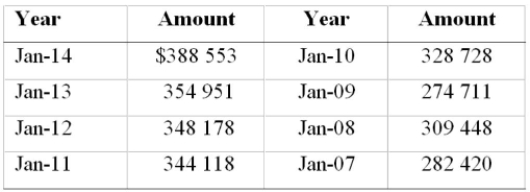
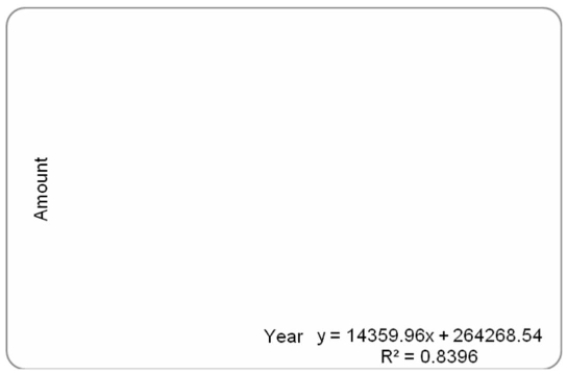 Forecast the average home price listing for Jan-14.
(Multiple Choice)
4.8/5 (36)
The merchants in Morris, Manitoba suffered flood damage in May 1997. Stores were closed for
Remodeling nearly two months. What is this type of variation in sales called?
(Multiple Choice)
4.8/5 (35)
Listed below is the net sales in $ million for Home Depot Inc., and its subsidiaries from 1994 to
2003. 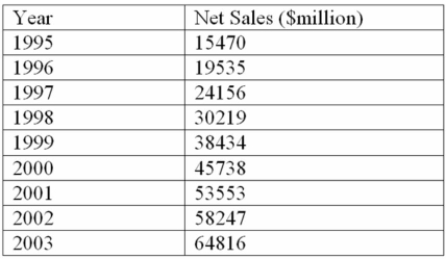 Using the printout below, what are the estimated sales for 2004?
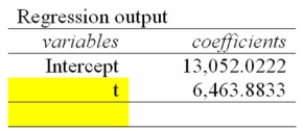
(Multiple Choice)
4.9/5 (35)
i. The moving average method merely smooths out the fluctuations in the data.
ii. The moving average method averages out cyclical (C) and irregular (I) components.
iii. Sales, production and other economic and business series usually have periods of oscillation that
Are of equal length or identical amplitudes.
(Multiple Choice)
4.8/5 (35)
If the least squares equation for sales data is ŷ = 10 + 1.3t ($ millions), with t = 0 in 1995, what is the
Value of t and the forecast for 2002?
(Multiple Choice)
4.9/5 (43)
i. If the sales, production or other data over a period of time tend to approximate a straight-line
Trend, the equation developed by the least squares method cannot be used to forecast sales for a
Future period.
ii. A straight-line trend equation is used to represent the time series when it is believed that the data
Is increasing (or decreasing) by equal amounts, on the average, from one period to another.
iii. If the past data approximates a straight line, the equation used is  = a + bt, where a is the y-
Intercept and b is the slope of the line.
= a + bt, where a is the y-
Intercept and b is the slope of the line.
(Multiple Choice)
4.9/5 (40)
If you have annual data for 1991 to 2002 and want to code the years for the calculation of the trend,
What should you code the year 1991?
(Multiple Choice)
4.8/5 (41)
You are trying to decide in which of the three companies you should invest. Refer to the following
Payoff Table. 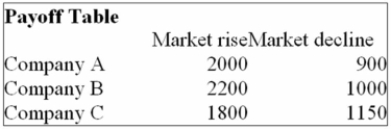 If the probability of the market declining in the next year is 0.5, which of the following statements
Are correct?
i. The Expected value of stock purchased under conditions of certainty is $1,675.
ii. The Expected value of perfect information is $75.
iii. The Expected value of perfect information is $180.
If the probability of the market declining in the next year is 0.5, which of the following statements
Are correct?
i. The Expected value of stock purchased under conditions of certainty is $1,675.
ii. The Expected value of perfect information is $75.
iii. The Expected value of perfect information is $180.
(Multiple Choice)
4.8/5 (36)
You are trying to decide in which of the three companies you should invest. Refer to the following
Payoff Table. 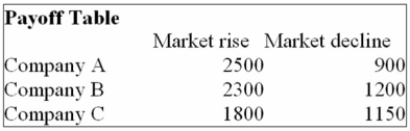 If the market rises in the next year, which of the following statements are correct?
i. The Opportunity Loss for Company A is $200.
ii. The Opportunity Loss for Company B is $200.
iii. The Opportunity Loss for Company C is $200.
If the market rises in the next year, which of the following statements are correct?
i. The Opportunity Loss for Company A is $200.
ii. The Opportunity Loss for Company B is $200.
iii. The Opportunity Loss for Company C is $200.
(Multiple Choice)
4.8/5 (35)
Filters
- Essay(0)
- Multiple Choice(0)
- Short Answer(0)
- True False(0)
- Matching(0)