Exam 16: Decision Making and Payoff Tables in Investment Scenarios
Exam 1: What Is Statistics79 Questions
Exam 2: Describing Data: Frequencydistributions and Graphic Presentation100 Questions
Exam 3: Describing Data: Numerical Measures214 Questions
Exam 4: Describing Data: Displaying and Exploring Pata138 Questions
Exam 5: A Sulvey of Probability Concepts121 Questions
Exam 6: Discrete Probability Distributions145 Questions
Exam 7: Continuous Probabilitydistributions79 Questions
Exam 8: Sampling Methods and the Central Umit Theorem134 Questions
Exam 9: Estimation and Confidence Intervals140 Questions
Exam 10: One-Sample Tests of Hypothesis111 Questions
Exam 11: Two Sample Tests of Hypothesis103 Questions
Exam 12: Analysis of Variance173 Questions
Exam 13: Linear Regression and Correlation132 Questions
Exam 14: Multiple Regression and Correlation Analysis126 Questions
Exam 15: Chi-Square Applications94 Questions
Exam 16: Decision Making and Payoff Tables in Investment Scenarios151 Questions
Select questions type
i. A time series is a collection of data recorded over a period of time, usually monthly, quarterly, or
Yearly.
ii. Episodic and residual variations can be projected into the future.
iii. A forecast is considered necessary in order to have the raw materials, production facilities, and
Staff available to meet estimated future demands.
(Multiple Choice)
4.8/5  (35)
(35)
i. In the linear trend equation, t is any value that corresponds with a time period, i.e., month or
Quarter.
ii. A straight-line trend equation is used to represent the time series when it is believed that the data
Is increasing (or decreasing) by equal amounts, on the average, from one period to another.
iii. If the past data approximates a straight line, the equation used is  = a + bt, where a is the y-
Intercept and b is the slope of the line.
= a + bt, where a is the y-
Intercept and b is the slope of the line.
(Multiple Choice)
4.8/5 (40)
i. A typical monthly seasonal index of 107.0 indicates that sales (or whatever the variable is) are 107
Percent above the annual average.
ii. The ratio-to-moving average method removes the time series trend component, resulting in 12
Numbers that are called specific seasonals.
iii. The total of the four typical quarterly indexes should equal 100.0.
(Multiple Choice)
4.9/5 (39)
In the calculation of 4-quarter seasonal indices the total of the quarterly means will be:
(Multiple Choice)
4.9/5 (32)
You have a decision to invest $10,000 in any of four different companies. You estimate the
Probabilities that the economy will be favorable or unfavorable and you estimate the percent
Returns over the next year. 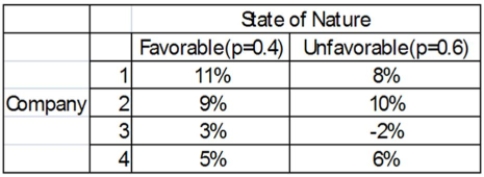 What is the expected value for Company 3?
(Multiple Choice)
4.7/5 (33)
i. The cyclical component of a time series is described in terms relative to the seasonal index.
ii. The irregular component of a time series is the easiest to measure.
iii. The ratio-to-moving average method removes the time series trend component, resulting in 12
Numbers that are called specific seasonals.
(Multiple Choice)
4.8/5 (36)
Economic periods of prosperity followed by recession are described as:
(Multiple Choice)
4.8/5 (38)
You are trying to decide in which of the three companies you should invest. Refer to the following
Payoff Table. 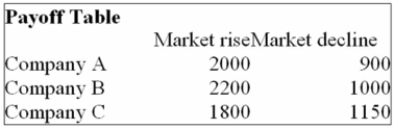 If the probability of the market declining in the next year is 0.5, which of the following statements
Are correct?
i. The Expected Opportunity Loss for Company A is $225.
ii. The Expected Opportunity Loss for Company B is $75.
iii. The Expected Opportunity Loss for Company C is $200.
If the probability of the market declining in the next year is 0.5, which of the following statements
Are correct?
i. The Expected Opportunity Loss for Company A is $225.
ii. The Expected Opportunity Loss for Company B is $75.
iii. The Expected Opportunity Loss for Company C is $200.
(Multiple Choice)
4.9/5 (41)
i. In a time series analysis, the letter "a" in the linear trend equation, is the value of  when t = 0.
ii. In the linear trend equation, the letter "b" is the average change in t for each change of one unit
(either increase or decrease) in y.
iii. In the linear trend equation, t is any value that corresponds with a time period, (i.e. month or
Quarter.
when t = 0.
ii. In the linear trend equation, the letter "b" is the average change in t for each change of one unit
(either increase or decrease) in y.
iii. In the linear trend equation, t is any value that corresponds with a time period, (i.e. month or
Quarter.
(Multiple Choice)
4.9/5 (28)
You are trying to decide in which of the three companies you should invest. Refer to the following
Payoff Table. 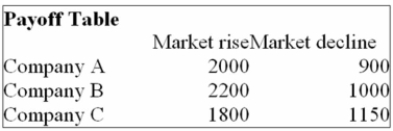 If the probability of the market declining in the next year is 0.5, which of the following statements
Are correct?
i. The Expected value of stock purchased under conditions of certainty is $1,980.
ii. The Expected value of perfect information is $75.
iii. The Expected value of perfect information is $180.
If the probability of the market declining in the next year is 0.5, which of the following statements
Are correct?
i. The Expected value of stock purchased under conditions of certainty is $1,980.
ii. The Expected value of perfect information is $75.
iii. The Expected value of perfect information is $180.
(Multiple Choice)
4.8/5 (38)
A plastics manufacturing performed a quarterly time series analysis for demands over the last five
Years (periods 1 through 20). The analysis resulted in the following trend equation and seasonal
Indexes:  = 920.0 + 22.6 t
 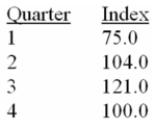 Based on the seasonal indexes, which quarter is expect to have 25% less demand than predicted
By the trend line?
Based on the seasonal indexes, which quarter is expect to have 25% less demand than predicted
By the trend line?
(Multiple Choice)
4.8/5 (40)
You are trying to decide in which of the three companies you should invest. Refer to the following
Payoff Table. 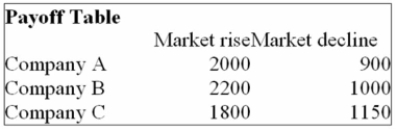 If the market rises in the next year, which of the following statements are correct?
i. The Opportunity Loss for Company A is $200.
ii. The Opportunity Loss for Company B is $200.
iii. The Opportunity Loss for Company C is $700.
If the market rises in the next year, which of the following statements are correct?
i. The Opportunity Loss for Company A is $200.
ii. The Opportunity Loss for Company B is $200.
iii. The Opportunity Loss for Company C is $700.
(Multiple Choice)
4.8/5 (42)
You are trying to decide in which of the three companies you should invest. Refer to the following
Payoff Table. 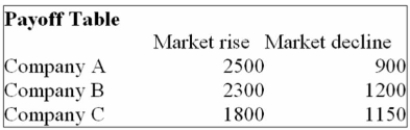 If the market declines in the next year, which of the following statements are correct?
i. The Opportunity Loss for Company A is $300.
ii. The Opportunity Loss for Company B is $30.
iii. The Opportunity Loss for Company C is $500.
If the market declines in the next year, which of the following statements are correct?
i. The Opportunity Loss for Company A is $300.
ii. The Opportunity Loss for Company B is $30.
iii. The Opportunity Loss for Company C is $500.
(Multiple Choice)
4.8/5 (40)
What is a disadvantage of estimating a trend line equation by "eye-balling" the best fitting line to a
Scatter diagram?
(Multiple Choice)
4.8/5 (36)
i. The ratio-to-moving-average method eliminates the seasonal, cyclical and irregular components
From the original data (y).
ii. The cyclical component of a time series is described in terms relative to the seasonal index.
iii. The irregular component of a time series is the easiest to measure.
(Multiple Choice)
4.7/5 (33)
i. For a quarterly time series, the initial step, using the ratio-to-moving average method, is to remove
The seasonal components from the time series using a 3-month centered moving average.
ii. In the ratio-to-moving-average procedure, using the median or modified mean eliminates trend.
iii. In the final step, using the ratio-to-moving-average method on quarterly data, the total of the
Modified means should theoretically be equal to 400 because the average of should be 100.
(Multiple Choice)
4.8/5 (45)
The Westberg Electric Company sells electric motors. The monthly trend equation, based on four
Years of monthly data, is Y' = 4.4 + 0.5t. The seasonal factor for the month of June is 105. Determine
The seasonally adjusted forecast for June of the fifth year.
(Multiple Choice)
4.9/5 (35)
How will data which increases (or decreases) by equal percents appear when plotted on graph
Paper having an arithmetic scale?
(Multiple Choice)
4.7/5 (40)
Filters
- Essay(0)
- Multiple Choice(0)
- Short Answer(0)
- True False(0)
- Matching(0)