Exam 16: Decision Making and Payoff Tables in Investment Scenarios
Exam 1: What Is Statistics79 Questions
Exam 2: Describing Data: Frequencydistributions and Graphic Presentation100 Questions
Exam 3: Describing Data: Numerical Measures214 Questions
Exam 4: Describing Data: Displaying and Exploring Pata138 Questions
Exam 5: A Sulvey of Probability Concepts121 Questions
Exam 6: Discrete Probability Distributions145 Questions
Exam 7: Continuous Probabilitydistributions79 Questions
Exam 8: Sampling Methods and the Central Umit Theorem134 Questions
Exam 9: Estimation and Confidence Intervals140 Questions
Exam 10: One-Sample Tests of Hypothesis111 Questions
Exam 11: Two Sample Tests of Hypothesis103 Questions
Exam 12: Analysis of Variance173 Questions
Exam 13: Linear Regression and Correlation132 Questions
Exam 14: Multiple Regression and Correlation Analysis126 Questions
Exam 15: Chi-Square Applications94 Questions
Exam 16: Decision Making and Payoff Tables in Investment Scenarios151 Questions
Select questions type
Listed below is the net sales in $ million for Home Depot Inc., and its subsidiaries from 1994 to
2003. 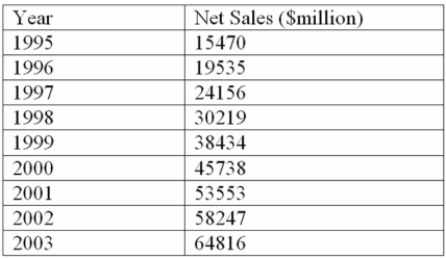 Using the printout below, what are the estimated sales for 2006?
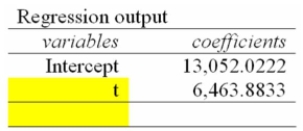
(Multiple Choice)
4.8/5  (38)
(38)
Why are long range predictions considered essential to managing a firm?
(Multiple Choice)
4.7/5 (42)
You are trying to decide in which of the three companies you should invest. Refer to the following
Payoff Table. 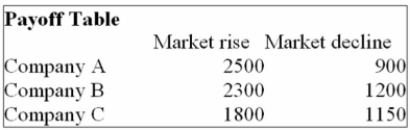 If the probability of the market declining in the next year is 0.4, which of the following statements
Are correct?
i. The Expected Opportunity Loss for Company A is $20.
ii. The Expected Opportunity Loss for Company B is $120.
iii. The Expected Opportunity Loss for Company C is $440.
If the probability of the market declining in the next year is 0.4, which of the following statements
Are correct?
i. The Expected Opportunity Loss for Company A is $20.
ii. The Expected Opportunity Loss for Company B is $120.
iii. The Expected Opportunity Loss for Company C is $440.
(Multiple Choice)
4.8/5 (39)
Given a linear time series trend,  = - 5.2 + 3.1t, what is the forecast for 2015 if the t = 0 in 2007?
(Multiple Choice)
4.7/5 (37)
A plastics manufacturing performed a quarterly time series analysis for demands over the last five
Years (periods 1 through 20). The analysis resulted in the following trend equation and seasonal
Indexes:  = 920.0 + 22.6 t
 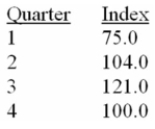 Based on the seasonal indexes, which quarter is expect to have 21% more demand than predicted
By the trend line?
Based on the seasonal indexes, which quarter is expect to have 21% more demand than predicted
By the trend line?
(Multiple Choice)
4.7/5 (36)
Which one of the following is not a component of a time series?
(Multiple Choice)
4.9/5 (37)
The table below shows the sales for a plastics manufacturer recorded over the past year. The
Seasonal indexes for each quarter are also provided. To track the trend for these four quarters, use
The indexes to deseasonalize the sales data. 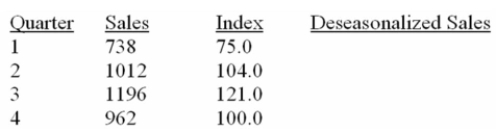 What are deseasonalized sales for quarter 1?
(Multiple Choice)
4.9/5 (40)
Determine the expected opportunity loss for the following payoff table. 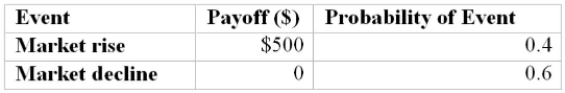
(Multiple Choice)
4.8/5 (41)
You have a decision to invest $10,000 in any of four different companies. You estimate the
Probabilities that the economy will be favorable or unfavorable and you estimate the percent
Returns over the next year. 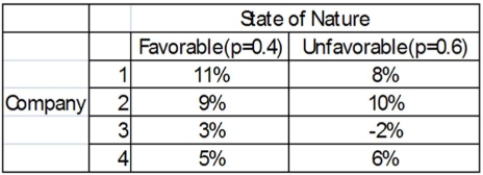 Based on the maximin criterion, what is the choice?
(Multiple Choice)
4.8/5 (38)
Below is the payoff table for two stocks based on whether the market rises or declines. Which of
The following represents the opportunity loss table? 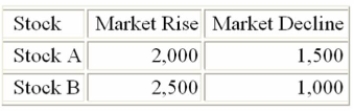
(Multiple Choice)
4.7/5 (37)
i. Using the ratio-to-moving-average method, dividing the actual sales for a month by the typical
Seasonal for that month results in a figure that includes only trend, cycle and irregular fluctuations.
This procedure is called deseasonalizing the sales.
ii. The reason for deseasonalizing a sales series is to remove trend and cyclical fluctuations so that
We can study seasonal fluctuations.
iii. Knowing the seasonal pattern in the form of indexes allows the retailer to deseasonalize sales.
(Multiple Choice)
4.8/5 (36)
The table below shows the sales for a plastics manufacturer recorded over the past year. The
Seasonal indexes for each quarter are also provided. To track the trend for these four quarters, use
The indexes to deseasonalize the sales data.  What are deseasonalized sales for quarter 3?
(Multiple Choice)
4.8/5 (41)
Teton Village contains shops, restaurants and motels. They have two peak seasons - winter for
Skiing, and summer for tourists visiting nearby parks. The specific seasonal with respect to the total
Sales volume for recent years are: 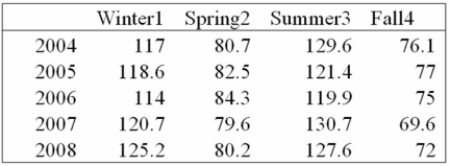 Using the seasonal indexes below, explain the typical index for the spring season.
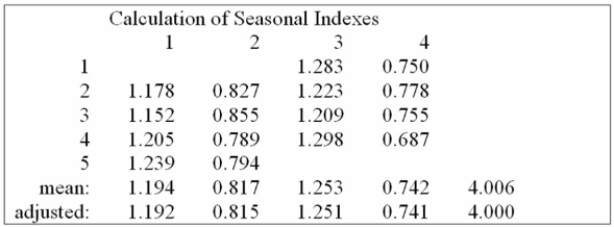
(Multiple Choice)
4.7/5 (32)
The following table lists the average price of home listings in Canada from January 2007 to January
2014. (See Connect for Data Set 7: CREA 2014). 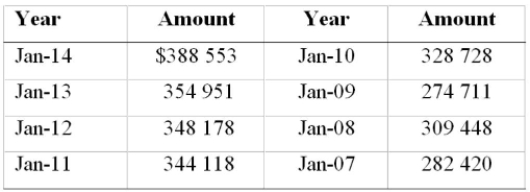
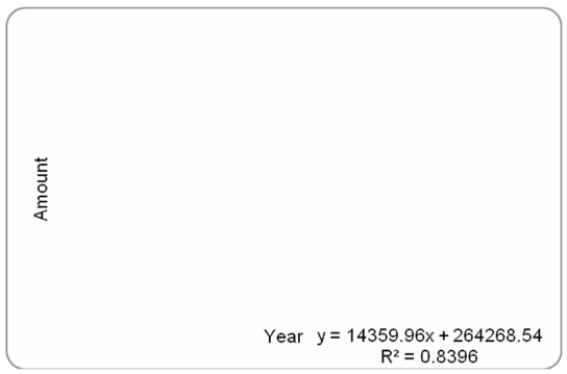 Forecast the average home price listing for Jan-16.
(Multiple Choice)
4.8/5 (35)
i. A forecast is considered necessary in order to have the raw materials, production facilities, and
Staff available to meet estimated future demands.
ii. One component of a time series is the secular trend that is the smooth movement of a series over
A short period of time, such as a few months or quarters.
iii. Many business and economic time series have a recurring seasonal pattern.
(Multiple Choice)
4.8/5 (33)
i. The moving average method merely smooths out the fluctuations in the data.
ii. The moving average method averages out cyclical (C) and irregular (I) components.
iii. To apply the moving average method to a time series, the data should follow a linear trend and
Have a definite rhythmic pattern of fluctuations that repeat (say, every three years).
(Multiple Choice)
4.9/5 (39)
You have a decision to invest $10,000 in any of four different companies. You estimate the
Probabilities that the economy will be favorable or unfavorable and you estimate the percent
Returns over the next year. 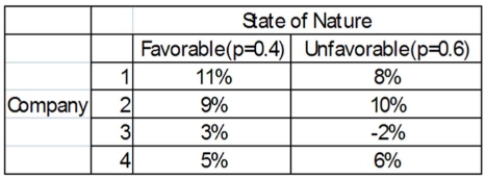 What is the expected value for Company 4?
(Multiple Choice)
4.9/5 (42)
You are trying to decide in which of the three companies you should invest. Refer to the following
Payoff Table. 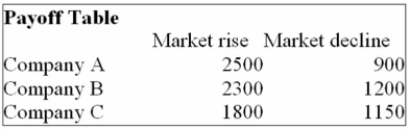 If the probability of the Market rising in the next year is 0.60, which of the following statements are
Correct?
i. The Opportunity Loss for Company A is $1,860.
ii. The Opportunity Loss for Company B is $1,860.
iii. The Opportunity Loss for Company C is $1,540.
If the probability of the Market rising in the next year is 0.60, which of the following statements are
Correct?
i. The Opportunity Loss for Company A is $1,860.
ii. The Opportunity Loss for Company B is $1,860.
iii. The Opportunity Loss for Company C is $1,540.
(Multiple Choice)
4.9/5 (33)
Consider the following decision table in which w, x, y, and z are decision alternatives and A and B
Are the two possible states of nature, with probabilities 0.40 and 0.60. 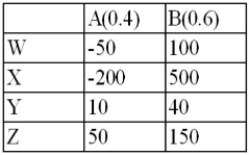 The expected value for decision W is ___________.
(Multiple Choice)
4.9/5 (35)
Filters
- Essay(0)
- Multiple Choice(0)
- Short Answer(0)
- True False(0)
- Matching(0)