Exam 16: Decision Making and Payoff Tables in Investment Scenarios
Exam 1: What Is Statistics79 Questions
Exam 2: Describing Data: Frequencydistributions and Graphic Presentation100 Questions
Exam 3: Describing Data: Numerical Measures214 Questions
Exam 4: Describing Data: Displaying and Exploring Pata138 Questions
Exam 5: A Sulvey of Probability Concepts121 Questions
Exam 6: Discrete Probability Distributions145 Questions
Exam 7: Continuous Probabilitydistributions79 Questions
Exam 8: Sampling Methods and the Central Umit Theorem134 Questions
Exam 9: Estimation and Confidence Intervals140 Questions
Exam 10: One-Sample Tests of Hypothesis111 Questions
Exam 11: Two Sample Tests of Hypothesis103 Questions
Exam 12: Analysis of Variance173 Questions
Exam 13: Linear Regression and Correlation132 Questions
Exam 14: Multiple Regression and Correlation Analysis126 Questions
Exam 15: Chi-Square Applications94 Questions
Exam 16: Decision Making and Payoff Tables in Investment Scenarios151 Questions
Select questions type
You are trying to decide in which of the three companies you should invest. Refer to the following
Payoff Table.  If the market declines in the next year, which of the following statements are correct?
i. The Opportunity Loss for Company A is $300.
ii. The Opportunity Loss for Company B is $0.
iii. The Opportunity Loss for Company C is $50.
If the market declines in the next year, which of the following statements are correct?
i. The Opportunity Loss for Company A is $300.
ii. The Opportunity Loss for Company B is $0.
iii. The Opportunity Loss for Company C is $50.
(Multiple Choice)
4.8/5  (31)
(31)
You have a decision to invest $10,000 in any of four different companies. You estimate the
Probabilities that the economy will be favorable or unfavorable and you estimate the percent
Returns over the next year. 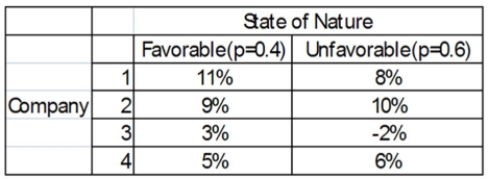 Based on expected value, what company do you choose?
(Multiple Choice)
4.7/5 (35)
i. In the ratio-to-moving-average procedure, using the median or modified mean eliminates trend.
ii. In the final step, using the ratio-to-moving-average method on quarterly data, the total of the
Modified means should theoretically be equal to 400 because the average of should be 100.
iii. Seasonal variation is quite common in the retail and wholesale industries.
(Multiple Choice)
4.8/5 (40)
i. A typical monthly seasonal index of 107.0 indicates that sales (or whatever the variable is) are 7
Percent above the annual average.
ii. For a quarterly time series, the initial step, using the ratio-to-moving average method, is to
Remove the seasonal components from the time series using a 3-month centered moving average.
iii. In the final step, using the ratio-to-moving-average method on quarterly data, the total of the
Modified means should theoretically be equal to 400 because the average of should be 100.
(Multiple Choice)
4.7/5 (39)
Consider the following decision table in which w, x, y, and z are decision alternatives and A and B
Are the two possible states of nature, with probabilities 0.40 and 0.60. 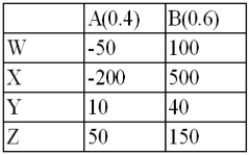 The expected value for decision X is ___________.
(Multiple Choice)
4.9/5 (38)
The following table lists the average price of home listings in Canada from January 2007 to January
2014. (See Connect for Data Set 7: CREA 2014). 
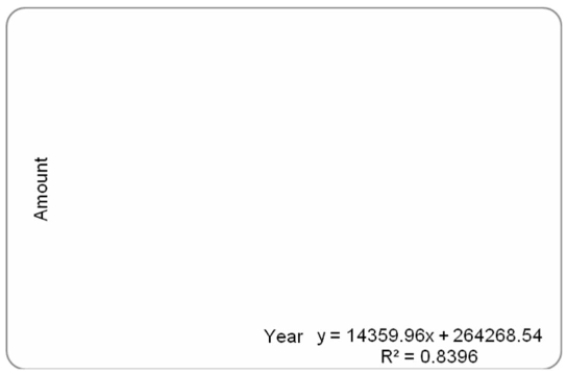 Forecast the average home price listing for Jan-17.
(Multiple Choice)
5.0/5 (36)
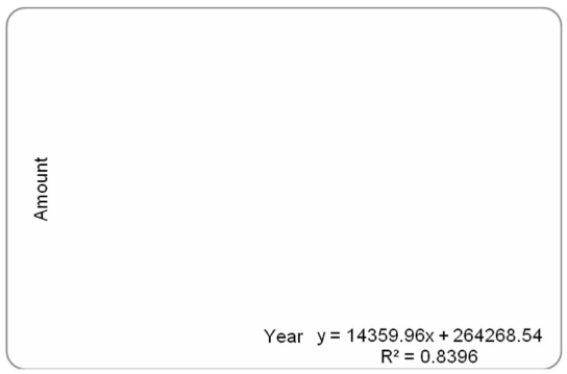
Listed below is the net sales in $ million for Home Depot Inc., and its subsidiaries from 1994 to
2003.  Using the printout below, what are the estimated sales for 2009?
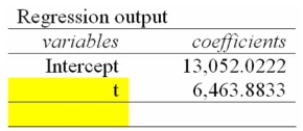
(Multiple Choice)
4.9/5 (27)
i. In the linear trend equation, the letter "b" is the average change in t for each change of one unit
(either increase or decrease) in y.
ii. The least squares method of computing the equation for a straight line going through the data of
Interest gives the "best fitting" line.
iii. A straight-line trend equation is used to represent the time series when it is believed that the
Data is increasing (or decreasing) by equal amounts, on the average, from one period to another.
(Multiple Choice)
4.9/5 (44)
i. In the final step, using the ratio-to-moving-average method on quarterly data, the total of the
Modified means should theoretically be equal to 400 because the average of should be 100.
ii. Seasonal variation is quite common in the retail and wholesale industries.
iii. A typical seasonal index of 103.7 for January indicates that sales for January are below the
Annual average.
(Multiple Choice)
4.8/5 (33)
You are trying to decide in which of the three companies you should invest. Refer to the following
Payoff Table. 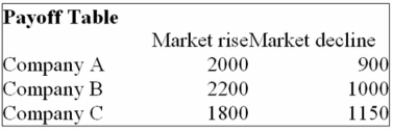 If the probability of the Market rising in the next year is 0.50, which of the following statements are
Correct?
i. The Expected Monetary Value for Company A is $1,450.
ii. The Expected Monetary Value for Company B is $1,960.
iii. The Expected Monetary Value for Company C is $1,500.
If the probability of the Market rising in the next year is 0.50, which of the following statements are
Correct?
i. The Expected Monetary Value for Company A is $1,450.
ii. The Expected Monetary Value for Company B is $1,960.
iii. The Expected Monetary Value for Company C is $1,500.
(Multiple Choice)
4.7/5 (28)
You are trying to decide in which of the three companies you should invest. Refer to the following
Payoff Table. 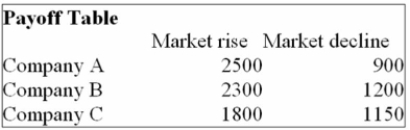 If the probability of the market declining in the next year is 0.4, which of the following statements
Are correct?
i. The Expected value of stock purchased under conditions of certainty is $1,980.
ii. The Expected value of perfect information is $120.
iii. The Expected value of perfect information is $180.
If the probability of the market declining in the next year is 0.4, which of the following statements
Are correct?
i. The Expected value of stock purchased under conditions of certainty is $1,980.
ii. The Expected value of perfect information is $120.
iii. The Expected value of perfect information is $180.
(Multiple Choice)
4.9/5 (42)
The Westberg Electric Company sells electric motors. The monthly trend equation, based on four
Years of monthly data, is Y' = 4.4 + 0.5t. The seasonal factor for the month of May is 85. Determine
The seasonally adjusted forecast for May of the fifth year.
(Multiple Choice)
4.9/5 (37)
For the below payoff table, if P(S1) = 0.3, P(S2) = 0.5 and P(S3) = 0.2, what decision would you recommend? 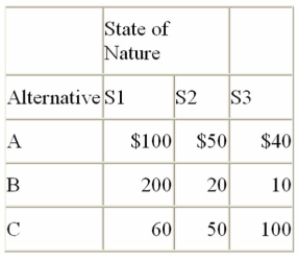
(Multiple Choice)
4.8/5 (35)
The table below shows the sales for a plastics manufacturer recorded over the past year. The
Seasonal indexes for each quarter are also provided. To track the trend for these four quarters, use
The indexes to deseasonalize the sales data. 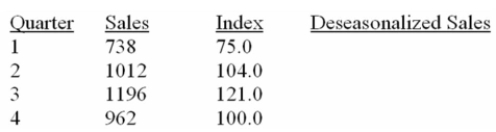 Overall, based on these four quarters, sales:
(Multiple Choice)
4.9/5 (40)
i. The moving average method merely smooths out the fluctuations in the data.
ii. To apply the moving average method to a time series, the data should follow a linear trend and
Have a definite rhythmic pattern of fluctuations that repeat (say, every three years).
iii. Sales, production and other economic and business series usually have periods of oscillation that
Are of equal length or identical amplitudes.
(Multiple Choice)
4.8/5 (34)
The following table lists the average price of home listings in Canada from January 2007 to January
2014. (See Connect for Data Set 7: CREA 2014). 
 Forecast the average home price listing for Jan-15.
(Multiple Choice)
4.8/5 (41)
Since a ski resort does most of its business in the winter, what is the major source of variation in
Income due to?
(Multiple Choice)
4.9/5 (43)
Listed below is the net sales in $ million for Home Depot Inc., and its subsidiaries from 1994 to
2003. 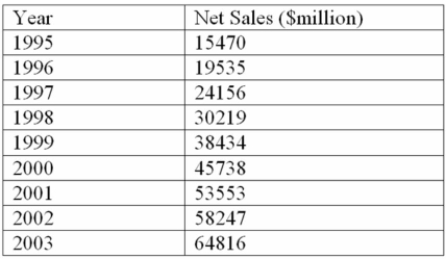 Using the printout below, what are the estimated sales for 2008?
(Multiple Choice)
4.8/5 (40)
You are trying to decide in which of the three companies you should invest. Refer to the following
Payoff Table. 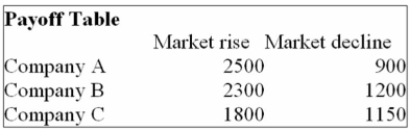 If the probability of the market declining in the next year is 0.4, which of the following statements
Are correct?
i. The Expected Opportunity Loss for Company A is $300.
ii. The Expected Opportunity Loss for Company B is $30.
iii. The Expected Opportunity Loss for Company C is $500.
If the probability of the market declining in the next year is 0.4, which of the following statements
Are correct?
i. The Expected Opportunity Loss for Company A is $300.
ii. The Expected Opportunity Loss for Company B is $30.
iii. The Expected Opportunity Loss for Company C is $500.
(Multiple Choice)
4.9/5 (39)
Filters
- Essay(0)
- Multiple Choice(0)
- Short Answer(0)
- True False(0)
- Matching(0)